

TL;DR:
- Mapping the CPG customer journey as a non-linear loop helps brands identify drop-off points and optimize for loyalty. Focus on every stage, especially consumption, to ensure high usage satisfaction and repeat purchases that drive lifetime value. Cross-functional teams and AI tools accelerate insight generation, enabling faster, more effective journey improvements.
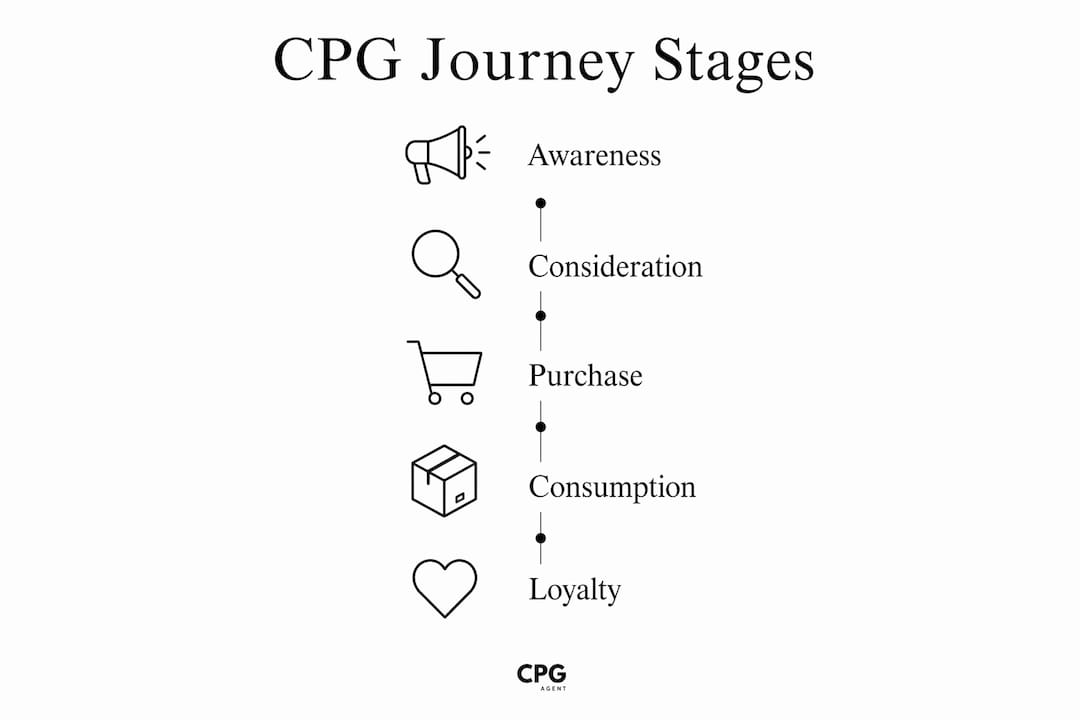
Map the consumer journey for your CPG brand as a five-stage, non-linear loop: awareness, consideration, first purchase, consumption/experience, and repurchase/loyalty/advocacy. The five-stage loop framework is grounded in real customer data, not assumptions. Your next step is a brief mapping sprint combining cohort analysis, tracking surveys, and an in-home usage test (IHUT). That sprint will deliver:
- A leakage map showing exactly where consumers drop out of the loop
- A prioritized experiment backlog ranked by unit-economics impact
- A measurement plan with stage-specific KPIs tied to CAC and LTV
Table of Contents
- What does mapping the CPG consumer journey actually mean?
- What data do you need and how do you collect it?
- How do you map omnichannel touchpoints and moments of truth?
- Which KPIs connect journey stages to unit economics?
- How do you find where unit economics leak?
- What team structure makes journey mapping repeatable?
- How does AI operationalize continuous journey mapping?
- What does a 4–6 week mapping sprint look like?
- Practical templates and a sprint checklist
- Key Takeaways
- What most teams get wrong about journey mapping
- Cpgagent runs this playbook faster than a traditional agency can scope it
- Useful sources
- FAQ
What does mapping the CPG consumer journey actually mean?
The journey is not a funnel. Consumers loop back, skip stages, and re-enter at unexpected points. A shopper who discovers your brand on TikTok may not purchase for six weeks, then buy three times in a month. That non-linear reality is why static path-to-purchase models fail CPG brands.
Each stage has a distinct brand objective and a small set of KPIs that actually matter:
- Awareness: Reach and unprompted brand recall. Goal: get into the consideration set before the shopping trip starts.
- Consideration: Consideration share and aided awareness. Goal: stay in the set when the shopper starts comparing.
- First purchase: Conversion rate and trial velocity by channel. Goal: convert intent into a transaction.
- Consumption/experience: Usage satisfaction and NPS. Goal: make the product experience good enough to earn a second purchase.
- Repurchase/loyalty/advocacy: Repeat rate, share of wallet, and referral rate. Goal: build the habit and turn buyers into advocates.
The consumption stage is the one most teams skip. That is a costly mistake. Ignoring consumption is a top cause of failed journey optimization because usage directly dictates repurchase. Post-purchase research using NPS, CSAT, and loyalty tracking delivers high ROI for identifying exactly what drives a second buy.
What data do you need and how do you collect it?
Sales data alone cannot explain why consumers switch or churn. You need both the "what" and the "why."

Quantitative sources tell you what happened: retail POS data, DTC e-commerce funnels, cohort repeat rates, retailer reporting, and media attribution.
Qualitative sources tell you why: IHUTs, mobile ethnography, focus groups, one-on-one interviews, and open-text survey responses.
| Research method | Best-use stage | Primary output |
|---|---|---|
| Cohort repeat-rate analysis | Repurchase/loyalty | Retention curve, LTV estimate |
| IHUT | Consumption/experience | Usage friction, satisfaction drivers |
| Path-to-purchase survey | Consideration, first purchase | Decision triggers, channel preference |
| Mobile diary / ethnography | Consumption/experience | Emotional engagement, habit formation |
| Tracking survey (quarterly or biannual) | Awareness, consideration | NPS trend, brand awareness, purchase intent |
Pro Tip: Run your IHUT with 15–20 recruited users and pair the session recordings with a short NPS survey sent 72 hours post-use. The gap between in-session enthusiasm and the 72-hour score is often where churn hides.
How do you map omnichannel touchpoints and moments of truth?
Start by listing every place a consumer encounters your brand: paid social, organic search, retailer product pages, shelf placement, packaging, in-store displays, DTC site, email, and post-purchase communications. Eliminating friction across digital and physical touchpoints is what converts omnichannel presence into actual retention.
A 90–120 minute workshop is the fastest way to build a shared touchpoint map. Run it with your brand lead, analytics owner, shopper marketing manager, and e-commerce lead. The agenda:
- Minutes 0–20: Each person writes customer quotes and observed behaviors on sticky notes, one per touchpoint.
- Minutes 20–50: Place touchpoints on a shared timeline from first exposure to post-purchase. Mark emotional high points and friction moments with colored dots.
- Minutes 50–80: Identify "moments of truth" — the three to five touchpoints where a consumer's decision to stay or leave is actually made.
- Minutes 80–120: Score each moment of truth on emotional engagement (high/medium/low) and friction (high/medium/low). Prioritize the high-friction, high-engagement intersections.
The output is a one-page touchpoint heatmap. Occasion-based signals and session recordings from your DTC site add behavioral texture that sticky notes alone cannot capture.
Pro Tip: Connected consumer products and smart-home ecosystems are opening new consumption-stage measurement options. If your category touches any IoT device, start logging that data now even if you have no immediate use for it.
Which KPIs connect journey stages to unit economics?
Every stage metric must trace back to CAC or LTV. Here is the model:
- Awareness: Aided awareness percentage and unprompted recall rate
- Consideration: Consideration share versus your top two category competitors
- First purchase: Trial conversion rate and cost per acquired buyer (CAC)
- Consumption: CSAT score and NPS
- Repurchase/loyalty: 90-day repeat rate, share of wallet, and referral rate
The math that makes this concrete: a 5% drop in 90-day repeat rate compresses LTV and extends payback period on every dollar spent acquiring that cohort. Small improvements in repeat behavior have outsized effects on LTV compared with equivalent lifts in acquisition. That asymmetry is why loyalty and advocacy research typically delivers higher ROI than acquisition optimization. For a full view of how stage metrics connect to media investment, the full-funnel marketing guide for CPG brands is worth a read.
Prioritization rule: Fix repeat rate before scaling acquisition spend. A leaky retention curve turns every new buyer into a sunk cost.
How do you find where unit economics leak?
Cohort analysis is the diagnostic tool. Run it in four steps:
- Define cohorts by first-purchase month and acquisition channel.
- Measure retention at 30, 60, and 90 days. Plot the retention curve.
- Isolate by SKU, retailer, and channel to find which combinations retain best.
- Compare heavy buyers (3+ purchases in 90 days) against light buyers (1 purchase) on demographics, usage occasion, and discovery channel.
Where the curve drops sharply, you have a leakage point. Trace it back: is the drop driven by a packaging issue surfaced in IHUTs? A pricing gap at a specific retailer? A weak post-purchase email sequence?
Once you have leakage points, prioritize experiments using an impact-versus-ease matrix:
- High impact, high ease: Run immediately (e.g., fix a confusing usage instruction on pack)
- High impact, low ease: Schedule for next sprint with dedicated resourcing
- Low impact, high ease: Batch into a single test week
- Low impact, low ease: Deprioritize
Each experiment needs a hypothesis, a primary metric, a minimum sample size, and a defined runtime before you start. Focus first on recurring revenue drivers: repeat purchase frequency moves unit economics faster than any single acquisition lever.
What team structure makes journey mapping repeatable?
Cross-functional teams that unify data across social, in-store, and e-commerce are a prerequisite for effective journey optimization. Siloed ownership produces inconsistent brand experiences and contradictory experiments.
The minimum viable team for a mapping sprint:
- Brand lead: Owns the journey map and experiment backlog
- Analytics owner: Pulls cohort data and builds the measurement plan
- Shopper marketing manager: Covers in-store and retailer touchpoints
- E-commerce lead: Owns DTC funnel data and digital touchpoints
- Insights lead: Designs and runs qualitative research (IHUTs, surveys)
Governance checklist:
- Single source of truth: one shared dashboard, not five spreadsheets
- Weekly insight standup (30 minutes): surface anomalies, flag stalled experiments
- Monthly sprint review: assess experiment results, update the backlog
- KPIs owned at the role level, not the team level
The most common failure mode is a fractured structure where sales and brand have separate data owners. Install a business translator — someone who can convert an insight into a commercial decision — and the problem largely solves itself. Strategic advisory roles often fill this gap when internal bandwidth is thin.
How does AI operationalize continuous journey mapping?
AI-driven journey mapping blends behavioral signals with attitudinal data to enable continuous learning and faster strategy pivots than static, periodic research allows. The practical use cases for CPG teams:
- Signal stitching: Combine DTC behavioral data, CRM purchase history, and survey attitudinal data into a single consumer profile
- Predictive propensity models: Score each cohort's likelihood to repurchase before the 90-day window closes
- Automated persona generation: Tools like PersonaForge build psychographic personas from behavioral and attitudinal inputs, replacing weeks of manual segmentation
- Anomaly detection: Flag a sudden drop in repeat rate or a spike in negative NPS before it shows up in quarterly sales data
- Pre-launch validation: Launch Validator runs pre-launch checks on new SKUs against existing consumer profiles, reducing the risk of a failed trial
When evaluating any AI tool for journey work, check four things: data connectors (can it ingest your retail and DTC data?), modeling transparency (can you see why a prediction was made?), action workflow triggers (does it push alerts to the right person?), and experiment integrations (can it feed directly into your test-and-learn backlog?).
| Capability | Why it matters for CPG journey mapping |
|---|---|
| Behavioral + attitudinal signal stitching | Reveals the "why" behind purchase and churn patterns |
| Psychographic persona generation (PersonaForge) | Replaces assumption-based targeting with data-driven segments |
| Pre-launch SKU validation (Launch Validator) | Catches misalignment between new products and existing consumer profiles |
| Anomaly detection | Surfaces leakage before it compounds across a full quarter |
For AI-powered consumer research methods and tool workflows, the Cpgagent platform is a practical starting point.
What does a 4–6 week mapping sprint look like?
- Week 0 (prep): Pull 12 months of cohort data, recruit IHUT participants, align the cross-functional team on scope and KPIs.
- Weeks 1–2 (research and mapping): Run the IHUT, field the tracking survey, conduct the touchpoint workshop, and map all digital and physical touchpoints.
- Week 3 (synthesis and prioritization): Build the leakage map, score experiments on the impact-versus-ease matrix, write prioritized experiment briefs.
- Weeks 4–6 (experiments and measurement): Launch the top two to three experiments, instrument measurement, run weekly standups, and hold a go/no-go gate at day 21.
Resourcing estimate: fractional dedication of key roles including analytics owner, insights lead, brand lead, and cross-functional coordinator. At the end of week 6, run a sprint review. If two or more experiments show positive signal, extend into a continuous quarterly program. Brand growth roadmap examples can help you sequence what comes after the first sprint.
Practical templates and a sprint checklist
Templates to build or download before week 0:
- Touchpoint heatmap: One-page grid mapping touchpoints by stage and channel, with emotional engagement and friction scores
- Cohort analysis workbook: Pre-built tabs for 30/60/90-day retention, channel breakdown, and LTV estimate
- IHUT brief: Recruitment criteria, session guide, NPS follow-up survey template
- Experiment brief: Hypothesis, primary metric, sample size, runtime, and go/no-go threshold
- One-page measurement dashboard: Stage KPIs, weekly actuals versus targets, and experiment status
Plug PersonaForge outputs directly into the IHUT recruitment criteria to ensure your test participants match your highest-value consumer segments. Run Launch Validator on any new SKU before the trial phase to catch positioning misalignment early.
Sprint checklist:
- Cohort data pulled and retention curve plotted
- IHUT recruited and scheduled
- Tracking survey fielded or scheduled
- Touchpoint workshop completed and heatmap built
- Moments of truth identified and scored
- Experiment backlog prioritized with impact-versus-ease matrix
- Measurement plan signed off by analytics owner
- Weekly standup cadence confirmed
Key Takeaways
Mapping the CPG consumer journey as a five-stage loop, with mixed-method measurement and cross-functional governance, is the most direct path to fixing unit-economics leakage and building durable repeat purchase.
| Point | Details |
|---|---|
| Five-stage loop, not a funnel | Map awareness through advocacy as a non-linear loop; consumers re-enter at any stage. |
| Consumption stage is the priority | Skipping post-purchase research is the top cause of failed journey optimization. |
| Mix quant and qual methods | Cohort data shows where consumers drop; IHUTs and surveys explain why. |
| Small repeat-rate gains beat big acquisition pushes | A 5% lift in 90-day repeat rate improves LTV more than an equivalent drop in CAC. |
| Cpgagent platform | PersonaForge and Launch Validator operationalize persona research and SKU validation inside a single sprint workflow. |
What most teams get wrong about journey mapping
The conventional wisdom says journey mapping is a research project. Run a study, build a pretty diagram, present it to leadership, and move on. That framing is why most journey maps gather dust.
The consumption stage is where this breaks down most visibly. Teams invest heavily in awareness and acquisition metrics because those numbers are easy to pull and easy to defend in a budget meeting. But the unit economics almost always point in the opposite direction: the biggest lever is what happens after the first purchase, not before it.
There is also a structural problem. When sales owns one data set and brand owns another, the journey map reflects two different versions of the consumer. No one can act on it because no one agrees on what it says. The fix is not a better tool. It is a governance decision: one source of truth, one owner per KPI, and a weekly ritual that forces the data into a shared conversation.
AI changes the speed of this work, not the logic. PersonaForge and Launch Validator accelerate the persona and validation steps that used to take weeks. But the underlying discipline — define the stage, measure the right thing, run a fast experiment, review the result — is the same whether you are doing it manually or with an automated platform.
Cpgagent runs this playbook faster than a traditional agency can scope it
Most agencies spend the first eight weeks in discovery. Cpgagent skips that. The platform combines AI-driven tools (PersonaForge for psychographic segmentation, Launch Validator for pre-launch SKU checks) with fractional CMO leadership, so your team gets senior strategic guidance without the overhead of a full-time hire or a long agency retainer.
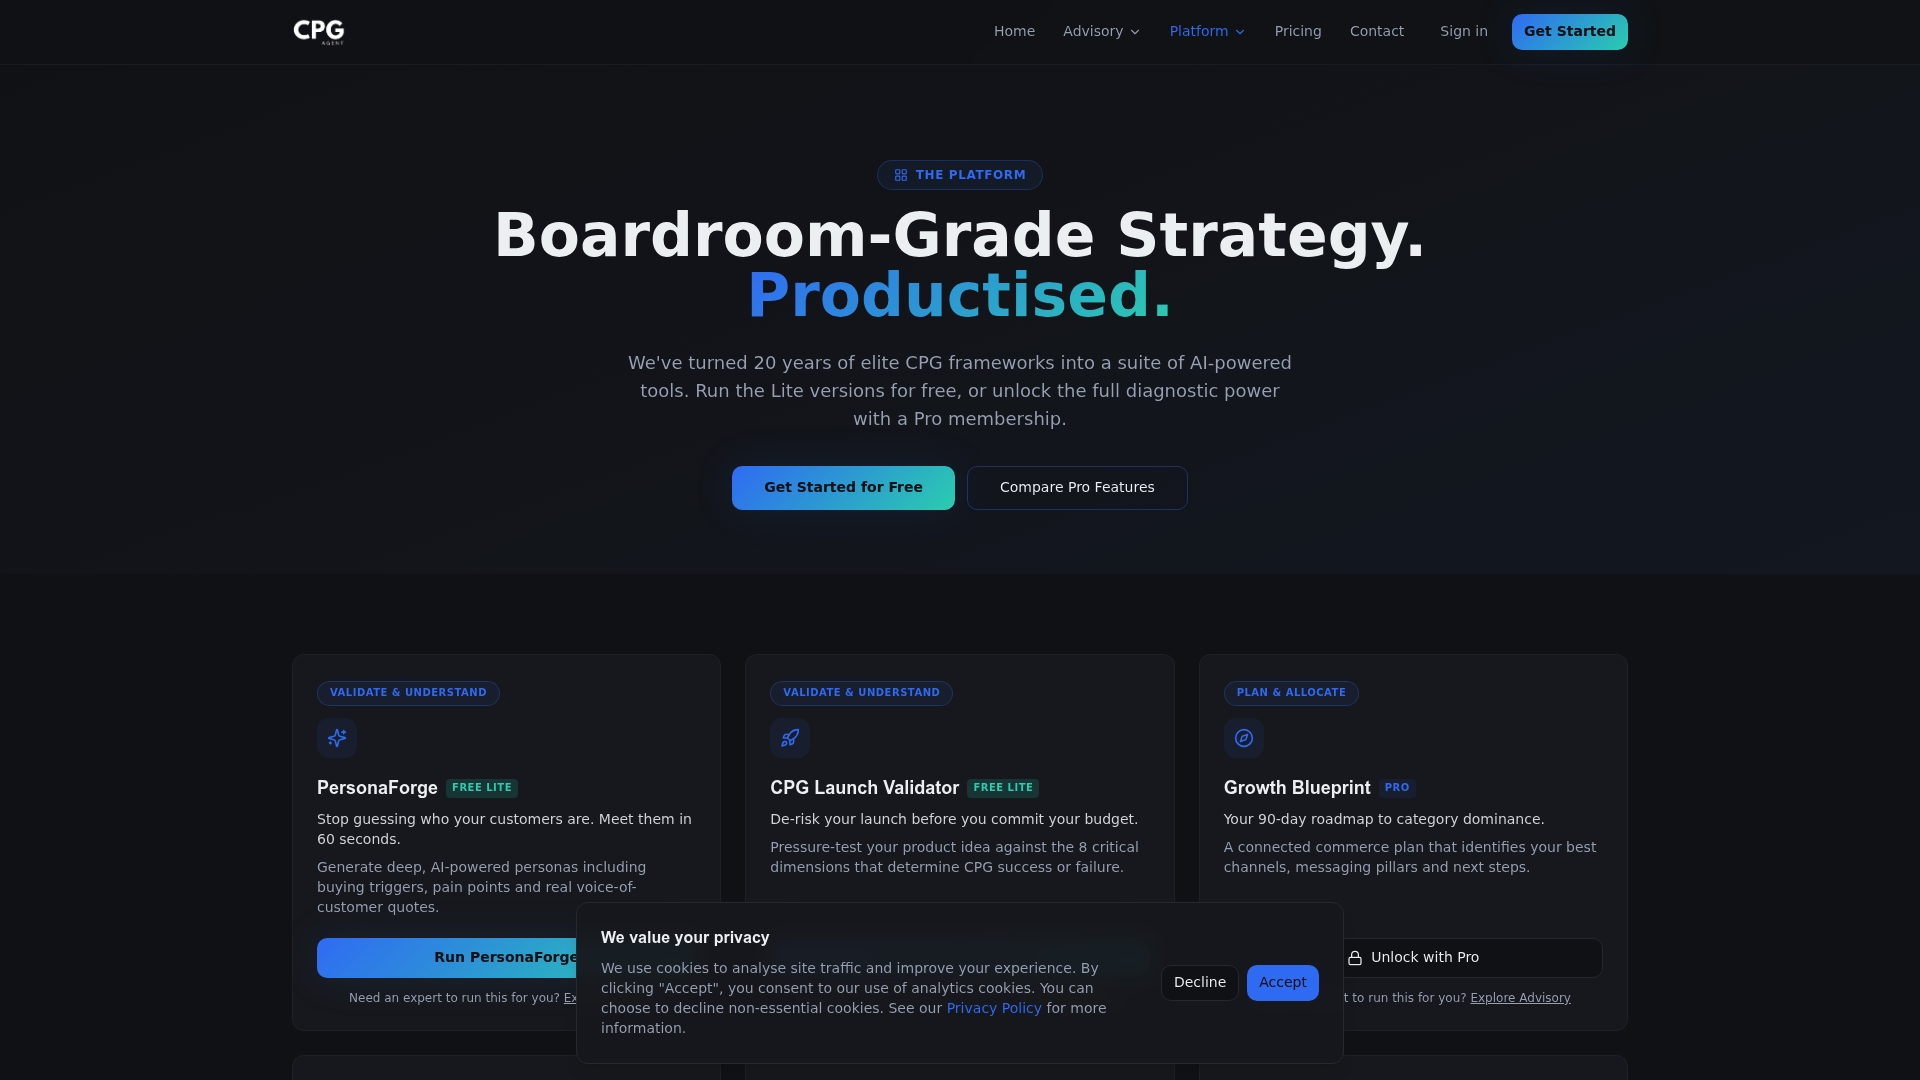
The concrete difference: a mapping sprint that typically takes a traditional agency three months can run in four to six weeks on the Cpgagent platform, with experiment briefs ready at week three. For CPG and FMCG brands that need to move at shelf speed, that gap matters. Book a platform demo at cpgagent.com/platform to see how PersonaForge and Launch Validator fit into your first sprint.
Useful sources
- Five-stage CPG journey framework and food and beverage mapping guide — consult for stage definitions and KPI examples
- How CPG brands optimize the customer journey — best source for mixed-methods rationale and loyalty research ROI
- Optimize the customer journey in CPG — cross-functional team structure and governance model
- Insight-driven customer journey mapping for CPG — AI persona generation and predictive propensity modeling
- Path-to-purchase mapping for SMB CPG brands — practical survey design and POS data integration
- Cpgagent platform — PersonaForge, Launch Validator, and platform demos
Run NPS, CSAT, and cohort repeat-rate measurement as standing quarterly practices. Biannual tracking studies give you the trend visibility to evaluate whether campaign investments are actually moving awareness and purchase intent over time.
FAQ
What are the five stages of the CPG consumer journey?
The five stages are awareness, consideration, first purchase, consumption/experience, and repurchase/loyalty/advocacy. They form a non-linear loop, not a sequential funnel.
Why is the consumption stage so important for CPG brands?
Usage experience directly determines whether a consumer repurchases. Skipping consumption-stage research is the leading cause of failed journey optimization because churn decisions are made at this stage, not at acquisition.
How do you identify leakage in a CPG consumer journey?
Run cohort analysis segmented by acquisition channel and SKU, plot 30/60/90-day retention curves, and compare heavy versus light buyers. Sharp drops in the retention curve mark leakage points to investigate with qualitative research.
What tools does Cpgagent offer for journey mapping?
Cpgagent's platform includes PersonaForge for psychographic persona generation and Launch Validator for pre-launch SKU validation, both designed to fit inside a 4–6 week mapping sprint.
How often should CPG brands run tracking studies?
Quarterly or biannual tracking studies with a fresh representative sample each wave provide the trend data needed to evaluate NPS, brand awareness, and purchase intent over time.