

TL;DR:
- Operational overhead increases fixed costs, shrinking profit margins and impacting valuation.
- Regular audits, process automation, and vendor consolidation can help reduce overhead efficiently.
Operational overhead reduces the percentage of revenue that becomes profit by inflating the fixed-cost base that every dollar of sales must first cover before a cent reaches the bottom line. Three checks you can run right now: calculate your overhead-to-revenue ratio (total overhead divided by revenue), look at payroll as a percentage of revenue, and divide total revenue by headcount to get revenue per employee. If overhead-to-revenue is high, payroll is a large share of revenue without a clear productivity story, or revenue per employee is declining quarter over quarter, overhead is likely compressing your margins. The urgency is real: a 3-percentage-point shift in overhead directly moves EBITDA by the same amount, which changes your valuation multiple and your pricing room simultaneously.
Table of Contents
- What do operational overhead, operating margin, and contribution margin actually mean?
- How does overhead reduce margins? The exact mechanisms
- Which overhead line items most often erode your margins?
- How do you measure overhead's impact on margins?
- Two scenarios that show margin compression and recovery
- What are the most effective strategies for reducing operational overhead?
- Why does overhead level affect your valuation and pricing strategy?
- How do you stop overhead from creeping back?
- Can AI and fractional leadership actually reduce overhead in 90 days?
- Your 8-step, 90-day checklist to protect margins from overhead
- Key Takeaways
- CPG brands that want faster margin recovery have a direct path
- Useful sources and further reading
- FAQ
What do operational overhead, operating margin, and contribution margin actually mean?
These three terms appear constantly in P&L conversations, and conflating them leads to bad decisions. Here are clean definitions and the formulas the rest of this article uses.
Operational overhead covers all indirect costs required to run the business that are not directly tied to producing a unit of product. Think rent, administrative payroll, IT subscriptions, insurance, corporate travel, depreciation, and finance function costs. They exist whether you sell one unit or one million.
Fixed vs. variable overhead: Fixed overhead stays flat regardless of volume (rent, base salaries). Variable overhead scales with activity but is still indirect (utilities, some shipping costs). Semi-fixed overhead steps up at thresholds (adding a warehouse when you hit a storage ceiling).
Key formulas:
- Operating margin = Operating income ÷ Revenue
- Overhead ratio = Total overhead ÷ Revenue
- Contribution margin per unit = Selling price − Variable cost per unit
- EBITDA = Operating income + Depreciation + Amortization
Overhead costs directly affect your profit margins, pricing decisions, and cash flow — and understanding the scope of what counts as overhead is the prerequisite for fixing it. For this guide, overhead includes all indirect, non-production costs: admin, facilities, non-production software, finance, legal, and any marketing spend that cannot be tied to a measurable revenue outcome.
How does overhead reduce margins? The exact mechanisms
Understanding why overhead compresses margins, not just that it does, is what lets you make the right cuts rather than the easy ones.
-
Contribution margin dilution. Every unit you sell generates a contribution margin (price minus variable cost). Fixed overhead must be covered before any of that contribution becomes profit. As overhead grows, the breakeven point rises, and a larger share of contribution margin is consumed before operating income appears. A brand doing $5M in revenue with $1.5M in fixed overhead needs to cover 30 cents of overhead per revenue dollar before profit starts. Add $300K in new overhead without matching revenue growth, and that figure jumps to 36 cents.
-
Pricing pressure. Uncontrolled overhead forces higher prices or lower margins and reduces competitiveness. When your cost structure demands a 45% gross margin to stay profitable but a competitor runs leaner at 35%, they can undercut your retail price, win shelf space, or invest the difference in trade spend. You are not losing on product quality; you are losing on overhead.
-
The Manual Wall. Operational costs often grow faster than revenue in scaling companies, causing margin shrinkage. Each additional hire and process multiplies coordination costs nonlinearly. A team of 10 has 45 possible communication pairs; a team of 50 has 1,225. The overhead of managing that complexity, in approvals, meetings, and rework, compounds silently.
-
Cash flow and working capital strain. High fixed overhead creates a floor of cash outflow every month regardless of revenue. In seasonal CPG businesses, this means carrying overhead through low-revenue periods, drawing down working capital, and reducing the cash available for inventory investment, trade promotions, or product development. The margin hit shows up on the P&L; the cash hit shows up in the bank account.
Which overhead line items most often erode your margins?
Knowing the categories is useful. Knowing which specific line items hide the biggest losses is where the audit gets interesting.
Fixed overhead (predictable, hard to cut quickly):
- Rent and facilities (office, warehouse, co-packing minimums)
- Base salaries for non-production roles (admin, finance, HR, management layers)
- Insurance premiums
- Depreciation on equipment and leasehold improvements
Semi-fixed overhead (step-cost structure):
- IT infrastructure that scales in tiers
- Outsourced service retainers (legal, accounting, PR)
- Distribution and 3PL base fees
Recurring subscriptions (the silent killers):
- Auto-renewing SaaS tools with low utilization
- Duplicated tooling across teams (three teams paying for separate project management platforms)
- Legacy vendor contracts that predate the current tech stack
The line items that most often hide are the ones that auto-renew without a budget owner reviewing them. A $400/month analytics platform that nobody logs into is invisible until someone runs a subscription audit. Multiply that across 20 tools and you are looking at $96,000 a year in dead overhead.
Pro Tip: Coordination and communication overhead often costs more than the software that enabled it. Before cutting tools, measure how much senior management time goes to tactical approvals and status updates. Reclaiming two hours per week per senior leader across a five-person leadership team is worth more than canceling most SaaS subscriptions.

Companies that switch to hybrid or remote office models often see significant savings on facility-related costs, making facilities a high-leverage target for brands willing to rethink their physical footprint.
How do you measure overhead's impact on margins?
Measurement comes before action. These are the formulas and KPIs that give you a clear picture.
Essential formulas:
- Overhead ratio = Total overhead ÷ Revenue (track monthly; benchmark against prior periods and industry)
- Revenue per employee = Total revenue ÷ Full-time equivalent headcount
- Payroll % of revenue = Total payroll cost ÷ Revenue
- Contribution margin % = (Revenue − Variable costs) ÷ Revenue
- EBITDA impact of overhead reduction = Overhead reduction × (1 − effective tax rate)
An overhead ratio below a certain moderate threshold is generally considered efficient for many small businesses; ratios above a higher threshold signal overhead may be eating into margins. Revenue per employee and payroll as a percentage of revenue are high-signal KPIs for detecting operational drag and should be reviewed quarterly at minimum.
Worked example: how a 3% overhead reduction flows through
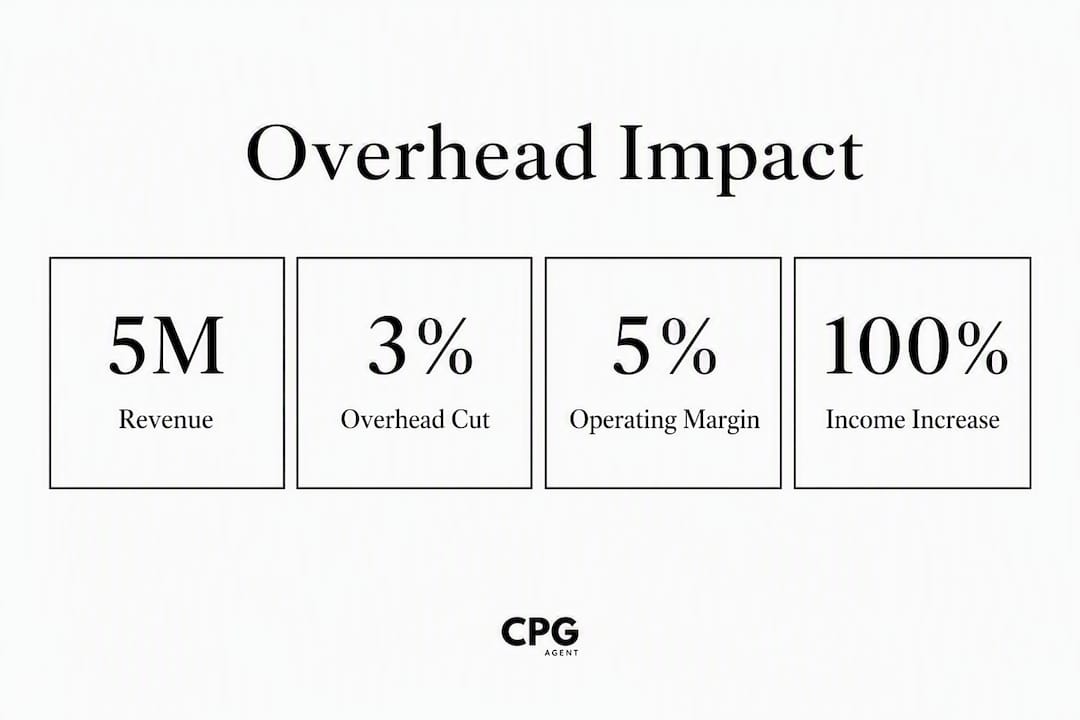
| Metric | Before | After (3% overhead cut) |
|---|---|---|
| Revenue | $5M | $5M |
| Operating income | $250,000 (5%) | — |
Three percentage points of overhead reduction doubles operating income in this scenario. That is not a rounding error; it is the difference between a business that attracts buyers and one that does not.
Monthly vs. quarterly tracking: Monitor overhead ratio and payroll % monthly to catch creep early. Do a full overhead-to-revenue deep-dive quarterly, including subscription counts and contract renewal dates. For product-level analysis, allocate shared overhead using a simple revenue-weighted method before moving to activity-based costing (ABC) if you need more precision.
For CPG brands specifically, margin readiness for major retail depends on having these numbers clean before a buyer or retailer asks for them.
Two scenarios that show margin compression and recovery
Numbers make the argument faster than words. These two scenarios use the same revenue base to isolate the overhead effect.

Scenario A: Revenue grows, but overhead creeps faster
| Year | Revenue | Overhead | Overhead % | Operating Margin |
|---|---|---|---|---|
| Year 1 | — | — | 30% | 12% |
| Year 2 | $5M | — | 35% | — |
| Year 3 | — | — | 40% | 3% |
Revenue grew 50% over three years. Operating margin collapsed from 12% to 3%. The business looks healthy on the top line and is quietly dying at the bottom.
Scenario B: Same Year 2 revenue, overhead reduced by 5 percentage points
| Metric | Scenario A (Year 2) | Scenario B (Year 2) |
|---|---|---|
| Revenue | $5M | $5M |
| Overhead | — | $1.5M (30%) |
| Operating income | — (—) | — |
| EBITDA (est.) | — | $750,000 |
Practitioners report reclaiming 8–12% of margin in under sixty days by auditing and cutting non-essential, auto-renewing costs. That is not a theoretical ceiling; it is what happens when someone actually runs the subscription audit and cancels the contracts nobody is using.
For sector context, the trucking industry illustrates how overhead sensitivity plays out at scale: per-mile operational costs and operating margins vary significantly by fleet size, with small operators often squeezed hardest when fixed costs rise faster than rate increases.
What are the most effective strategies for reducing operational overhead?
Tactics vary in speed, complexity, and risk. Here is a prioritized menu with honest tradeoffs.
Highest ROI, lowest disruption:
- Subscription and contract audit. Assign one owner, give them 30 days, and produce a list of every recurring cost with utilization data. Cancel or renegotiate anything below a utilization threshold you define.
- Vendor consolidation. Paying three vendors for overlapping services is common. Consolidating to one often cuts cost 20–40% and reduces management overhead.
- Renegotiation. Long-standing vendor relationships often carry rates set years ago. A single conversation with a 3PL or co-packer can recover meaningful margin, especially if you can offer volume commitments or faster payment terms.
Medium ROI, moderate effort:
- Automation and AI. Businesses report notable reductions in administrative overhead through automation in applied cases. Start with the highest-volume, most repetitive processes: purchase order processing, reporting, retail audit data collection. An automated retail shelf audit replaces manual field work that costs multiples of the software.
- Process simplification. Map the five most approval-heavy workflows in your business. Cut approval layers that do not add decision quality. Reducing a five-step approval to two steps on a $10,000 purchase order is not a risk; it is a time recovery.
- Outsourcing and shared services. Finance ops, HR administration, and IT support are candidates for outsourcing when internal headcount is expensive relative to specialist providers. The tradeoff is response time and institutional knowledge; mitigate by keeping one internal owner per function.
Longer horizon, higher impact:
- SKU rationalization. Every SKU carries overhead: forecasting time, inventory carrying cost, co-packing complexity. Cutting the bottom 20% of SKUs by contribution margin often improves overall margin by more than the lost revenue suggests, because the overhead savings are disproportionate.
- Facility strategy. Hybrid and remote models reduce facility costs materially. For brands with underutilized office space, subletting or downsizing is one of the fastest large-dollar wins available.
- Workforce optimization. Fractional leadership (CMO, CFO, VP of Supply Chain) replaces full-time senior overhead with variable cost tied to specific outcomes. CPG brands that scale marketing without account executives demonstrate that senior capability does not require full-time headcount.
The tradeoff you cannot ignore: Cutting overhead aggressively without protecting capacity, morale, and customer experience is how companies save their way into irrelevance. Every cut should be evaluated against the question: does this reduce cost without reducing the output that drives revenue? If the answer is uncertain, pilot before committing.
Why does overhead level affect your valuation and pricing strategy?
Buyers and investors do not just look at revenue. They look at what percentage of revenue survives as cash flow, and overhead is the primary variable they can influence post-acquisition.
Sellers who fail to monitor overhead risk inflated expense structures and weaker margins, which directly reduces the EBITDA multiple a buyer will apply. A business generating $750,000 in EBITDA at a 6x multiple is worth $4.5M. Reduce overhead by $150,000 and EBITDA becomes $900,000; at the same multiple, the business is worth $5.4M. That $150,000 in overhead reduction created $900,000 in enterprise value.
What buyers actually look for:
- Recurring vs. one-time overhead (recurring is discounted more heavily because it persists post-close)
- Controllable overhead as a percentage of revenue (high controllable overhead signals value creation opportunity)
- Owner-dependent overhead (costs that disappear when the founder exits, like personal vehicles or family payroll)
- Trend direction (overhead ratio rising over three years is a red flag regardless of absolute level)
Pricing strategy implications: When overhead is high, you face a binary: raise prices or accept lower margins. Raising prices works until you hit competitive resistance. Reducing overhead gives you the third option: hold price, improve margin, and use the recovered cash to fund trade spend or product development that competitors cannot match.
Language for leadership conversations: "Our overhead ratio has moved from 30% to 36% over 24 months. At current revenue, that represents $300,000 in additional annual cost that is not generating proportional output. Returning to 30% adds $300,000 to EBITDA, which at a conservative 5x multiple adds $1.5M to enterprise value."
How do you stop overhead from creeping back?
One-off cost-cutting exercises rarely hold. Quarterly overhead audits focused on a few high-signal KPIs are more effective than annual reviews that arrive too late to catch the drift.
Recommended governance cadence:
- Monthly operational KPI review. Track overhead ratio, payroll % of revenue, and revenue per employee. Flag any metric that moves more than 1 percentage point month over month without an approved business reason.
- Quarterly overhead deep-dive. Review subscription count, contract renewal dates, and headcount-to-revenue ratio. Compare against the prior quarter and the same quarter last year.
- Annual zero-based review. Rebuild the overhead budget from zero rather than incrementing last year's actuals. Every line item must justify its existence against current business needs.
Dashboard essentials: Revenue per employee, overhead-to-revenue ratio, payroll % of revenue, active subscription count, and a contract renewal calendar with 90-day advance flags.
Red flags that should trigger immediate action:
- Subscription count growing faster than headcount or revenue
- Senior leaders spending more than 20% of their time on tactical approvals
- Approval cycle times increasing without a volume explanation
- Overhead ratio rising for two consecutive quarters
- New hires added to support internal coordination rather than customer-facing output
Who runs the review: Finance lead owns the numbers. Operations lead owns the process audit. A fractional CFO or COO is often the right chair for the quarterly deep-dive in growth-stage companies where the internal team lacks bandwidth for objective self-assessment.
Can AI and fractional leadership actually reduce overhead in 90 days?
The honest answer is yes, for specific categories, with a structured approach.
Businesses report notable reductions in administrative overhead through automation in applied cases. The categories where automation delivers fastest are data collection, reporting, purchase order processing, and compliance documentation. These are also the categories where CPG brands tend to carry the most manual headcount relative to output.
A 90-day pilot structure:
- Days 1–14 (Assessment). Map current overhead by category. Identify the three highest-cost manual processes. Baseline current labor hours and cost per process. Produce an overhead register with owner, cost, and utilization data.
- Days 15–60 (Implement). Deploy automation for the top two processes. Engage fractional leadership (marketing ops, finance ops, or supply chain) to own the implementation and measure output. Run the subscription audit and cancel or renegotiate within this window.
- Days 61–90 (Measure and iterate). Compare overhead ratio, revenue per employee, and EBITDA against the Day 1 baseline. Identify the next two processes for automation. Present findings to leadership with a 12-month projection.
Where fractional leadership creates the fastest margin impact: Marketing operations (eliminating agency retainer overhead), finance operations (replacing manual reporting with automated dashboards), and supply chain (renegotiating vendor contracts with data-backed leverage). These three functions together often account for the largest controllable overhead in a mid-size CPG brand.
Pro Tip: The 90-day pilot works best when the fractional leader has a clear deliverable: a measurable reduction in overhead ratio, not just a list of recommendations. Tie the engagement to an output metric from day one.
For brands building toward this model, an automated CPG growth roadmap shows how automation and fractional leadership combine to reduce operational drag while maintaining growth velocity.
Your 8-step, 90-day checklist to protect margins from overhead
| Step | Timebox | Owner | Deliverable |
|---|---|---|---|
| 1. Build the overhead register | — | Finance lead | Complete list of all overhead by category, cost, and owner |
| 2. Run the subscription audit | — | Finance + Ops lead | Utilization data for every recurring SaaS and service contract |
| 3. Cancel or flag for renegotiation | — | Finance lead | Confirmed cancellations and renegotiation targets |
| 4. Map the top 3 manual processes | — | Ops lead | Process maps with labor hours and cost per process |
| 5. Scope the automation pilot | — | Ops lead + Product owner | Pilot scope, tool selection, and success metrics |
| 6. Engage fractional leadership | — | CEO/CFO | Signed engagement with output-based deliverables |
| Implement automation and measure | — | Ops lead | Live automation, weekly overhead KPI dashboard |
| 8. Present findings and set governance | — | Finance lead | Board-ready summary, quarterly review cadence, red flag triggers |
Key Takeaways
Operational overhead directly reduces operating margin dollar-for-dollar, and a 3–5 percentage point reduction in overhead ratio can double operating income on a $5M revenue base without changing a single price or product.
| Point | Details |
|---|---|
| Overhead ratio benchmark | For most small and mid-size businesses, an overhead ratio under 25% is generally efficient; above 35% signals overhead may be eating into margins. The right benchmark varies by industry, but the trend direction matters as much as the absolute level. |
| EBITDA leverage | A $150,000 overhead reduction adds $900,000 in enterprise value at a 6x EBITDA multiple. |
| Fastest wins | Subscription audits and contract renegotiations can reclaim 8–12% of margin in under 60 days. |
| Governance cadence | Monthly KPI reviews plus quarterly deep-dives prevent overhead from creeping back after cuts. |
| Cpgagent's role | Cpgagent's AI tools and fractional leadership advisory accelerate the audit, automation, and governance steps for CPG and FMCG brands. |
The overhead problem is a strategy problem, not just a cost problem
Most overhead conversations get framed as cost-cutting exercises, and that framing is why they fail. You cut 10%, overhead creeps back within 18 months, and you repeat the cycle. The brands that actually hold their margin gains treat overhead management the same way they treat pricing strategy: as a continuous, governed discipline with owners, metrics, and a review cadence.
The deeper issue is that overhead accumulates through decisions that each made sense individually. A new hire to handle a growing workload. A software subscription that solved a real problem. A vendor contract that was competitive three years ago. None of these are mistakes in isolation. The mistake is the absence of a system that asks, quarterly, whether the aggregate cost structure still reflects the business you are running today.
For CPG brands specifically, the overhead problem compounds because the category demands constant investment in trade, marketing, and product development. Every dollar sitting in dead overhead is a dollar not funding a promotional event, a new SKU test, or a retail expansion. The opportunity cost of overhead is not just margin; it is competitive position.
The 90-day pilot structure in this article is not a magic fix. It is a forcing function: a structured way to make the overhead conversation concrete, assign owners, and produce a number that leadership can act on. The brands that run it consistently find that the first cycle surfaces more savings than expected, and the governance model that follows prevents the drift from starting again.
CPG brands that want faster margin recovery have a direct path
Cutting overhead manually takes time most CPG and FMCG teams do not have. Cpgagent gives brands a faster route: AI-powered tools that automate the audit, reporting, and process mapping work, paired with fractional CMO and senior marketing leadership that replaces high-cost agency retainers with outcome-based engagements. The result is a measurable reduction in overhead ratio without the six-month consulting engagement or the internal bandwidth drain.
The platform is built for brands at the stage where overhead is starting to outpace revenue growth and the team needs both the tools and the senior judgment to fix it quickly. Setup is minimal, and the engagement model is designed to show measurable ROI within 90 days. If the checklist above is where you want to start, the Cpgagent platform is the fastest way to run it with expert support behind every step.
Useful sources and further reading
- Operating Margin: Covering Costs and Turning Sales Into Profits — grounds the relationship between overhead and operating margin; used in the definitions and mechanics sections.
- Overhead: What It Means in Business | Investopedia — authoritative framing of overhead as a pricing and competitiveness issue; used in mechanics and valuation sections.
- Overhead Costs: What They Are, How to Calculate and Reduce Them | Beancount.io — benchmark data on overhead ratios, automation savings, and facility cost reductions; used throughout.
- Analysis of the Operational Costs of Trucking: 2026 Update (ATRI) — sector-level example of how per-unit operational costs shift margins; used in numerical examples for industry context.
FAQ
What affects operating margins the most?
Fixed overhead is the primary driver of operating margin compression. When overhead grows faster than revenue, the percentage of each revenue dollar that reaches operating income shrinks, even when gross margin holds steady.
Does operating margin include overhead?
Yes. Operating margin reflects revenue after all operating costs, including overhead such as rent, administrative payroll, IT, and insurance. It is calculated as operating income divided by revenue, where operating income is gross profit minus all operating expenses including overhead.
How do you improve operating margin?
The fastest path is reducing overhead ratio through a subscription audit, vendor renegotiation, and process automation. Practitioners report reclaiming 8–12% of margin in under sixty days by eliminating non-essential, auto-renewing costs before touching headcount or pricing.
What is a healthy overhead-to-revenue ratio?
For most small and mid-size businesses, an overhead ratio under 25% is generally efficient; above 35% signals overhead may be eating into margins. The right benchmark varies by industry, but the trend direction matters as much as the absolute level.
How can CPG brands reduce overhead without cutting growth investment?
Replacing full-time agency retainers with fractional leadership and automating high-volume manual processes (reporting, retail audits, purchase order processing) reduces overhead without cutting the marketing and trade investment that drives revenue. Cpgagent's platform and fractional CMO services are built specifically for this tradeoff in CPG and FMCG businesses.