

Trade spend optimization is not about shrinking the trade budget. It's the practice of reallocating the same dollars away from weak promotions and into the tactics that deliver the best incremental ROI, measured net of cannibalization and post-promo dip. The right way to start is a bounded test, moving 15 to 25% of spend into higher-performing patterns for one cycle, then re-measuring before you commit further.
TL;DR:
- Reallocating 15 to 25% of trade spend into top-performing promotion patterns can significantly improve incremental ROI without increasing total budget.
- Accurate data integration from POS, shipment, deductions, and ledger systems is crucial for reliable ROI measurement and effective reallocation decisions.
- Ranking promotions by incremental ROI, not headline lift, helps identify waste and guides targeted shifts toward mechanics and accounts with better response rates.
- Running discipline-focused, bounded cycles consistently over multiple periods yields ongoing improvements, rather than seeking one-time overhauls.
- Using platform-supported scenario analysis and fractional advisory accelerates the implementation of trade spend optimization without lengthy internal development.
Table of Contents
- What Is Trade Spend Optimization, and How Is It Different From TPM?
- Why Trade Spend Optimization Matters for ROI and Margin
- What Data Do You Need Before You Can Optimize?
- How Do You Run the Trade Spend Optimization Loop?
- Four Levers and the Waste Fingerprints Hiding in Your Data
- How Do You Actually Run a Bounded Optimization Cycle?
- Which Tools Actually Support Trade Spend Optimization?
- The Bottom Line on Optimizing Trade Spend This Quarter
- Getting Cross-Functional Buy-In for Trade Spend Changes
- What Do Real Trade Spend Optimization Wins Actually Look Like?
- How Should You Forecast Promotional Effectiveness?
- Where Does Competitive Intelligence Fit Into Trade Spend Decisions?
- How Do You Prevent Trade Spend Leakage and Stay Compliant?
- Why Steady Cycles Beat Big Annual Overhauls
- How Cpgagent Helps You Optimize Trade Spend Faster
- Sources
- FAQ
What Is Trade Spend Optimization, and How Is It Different From TPM?
Trade promotion management (TPM) is the system of record. It handles the mechanics: planning promotions, tracking deductions, reconciling accruals, and settling with retailers. Trade promotion optimization (TPO) sits on top of that infrastructure and asks a harder question. Given everything you know about past performance, where should the next dollar actually go?
That distinction matters because teams often confuse the two. TPM tells you what happened and processes the paperwork. TPO analyzes past promotion performance and market data to forecast which tactics will produce the best return going forward. TPM without TPO is a well-organized ledger with no strategy attached to it.
The reallocation mindset matters just as much as the technical distinction. Optimization means holding total spend constant and shifting dollars from underperforming events to better ones until returns even out across your calendar.
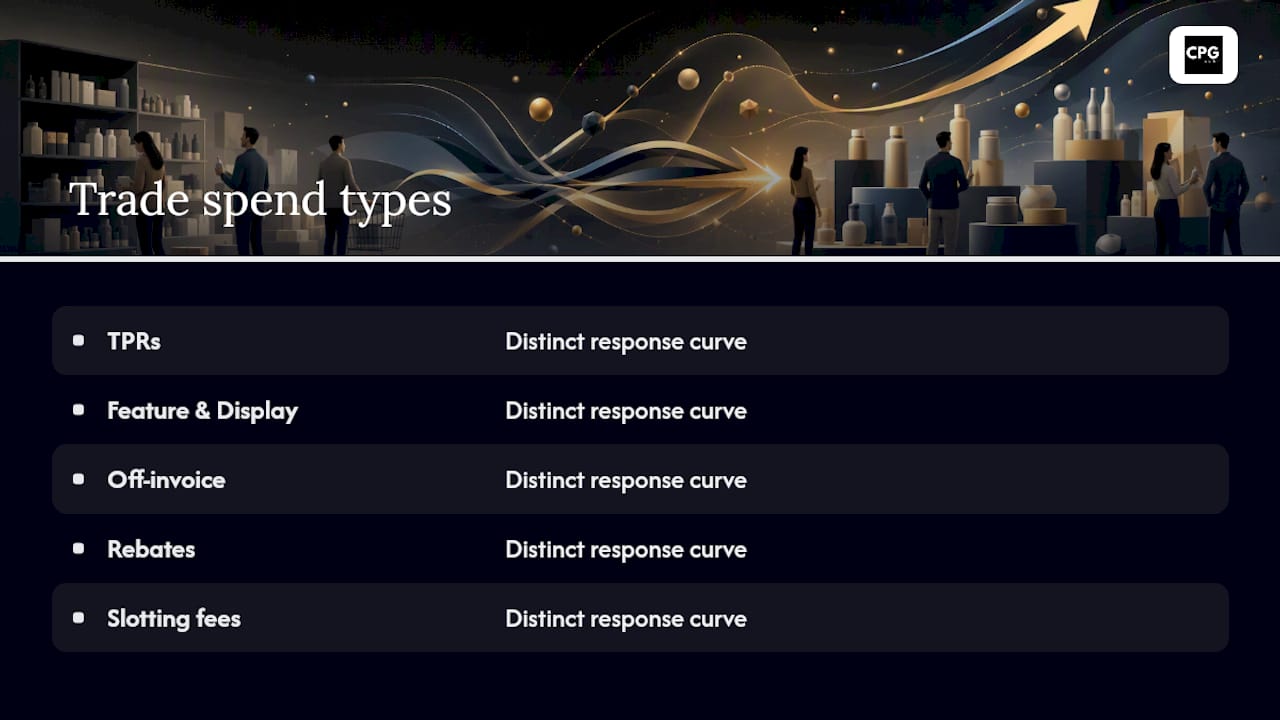
Trade spend itself takes several forms: temporary price reductions (TPRs), feature and display support, off-invoice discounts, rebates, and slotting fees. Each has a different response curve, and lumping them together is one of the fastest ways to misread what's actually working.
Why Trade Spend Optimization Matters for ROI and Margin
Trade spend usually shows up as a deduction against gross revenue, which means bad promotions erode margin quietly, line by line, without ever triggering an alarm on a summary P&L. A brand running $40 million in trade spend with even a few points of waste is bleeding real profit dollars every quarter, invisible until someone actually decomposes the spend by event.
The headline metric most teams report, lift, is the wrong one to manage against. A promotion that moves 20,000 extra units looks like a win until you account for the customers who would have bought anyway, and the ones who simply bought early and skipped the following two weeks. Incremental ROI, net of cannibalization and the post-promo dip, is the number that tells you whether a promotion actually grew the pie or just moved volume around a calendar.
Getting this right also changes conversations that happen outside the promotion calendar. Finance teams that can point to incremental ROI by account and mechanic walk into retailer negotiations with real leverage instead of anecdotes, and forecasting gets sharper because you're not extrapolating from inflated lift numbers. For a deeper look at the KPIs that feed this, see how trade spend efficiency is measured across a promotional calendar.
What Data Do You Need Before You Can Optimize?
You cannot optimize what you cannot measure accurately, and that starts with data most CPG teams already have scattered across five systems. The essential set: POS and depletions data, shipment and distribution records, invoice and deduction files, promotion backup documentation, and general ledger entries for accrual reconciliation.
Reliable trade spend optimization requires these sources integrated into a single source of truth, not five spreadsheets that each tell a slightly different story about the same event. Without that integration, teams end up estimating incremental lift instead of calculating it, and estimates trend toward whatever number justifies last year's plan.
Baselines matter more than most teams realize. If your baseline sales projection for a SKU is wrong, every incremental ROI calculation built on top of it is wrong too, no matter how sophisticated the model. Enterprise trade platforms typically span planning through settlement and accrual reconciliation, which closes the loop between what was planned and what actually got paid out.
Common failure modes: depletions data that lags shipments by weeks, deduction files that don't map cleanly to specific promotion events, and GL entries that get coded to the wrong cost center. Fix these before you touch reallocation. Depletion and sell-through data is often the weakest link, and it feeds directly into every ROI number downstream.
How Do You Run the Trade Spend Optimization Loop?
The cycle is simple to describe and genuinely hard to execute well: measure, identify waste, reallocate, re-measure. Most brands that struggle with TPO aren't missing sophistication. They're missing discipline in running this loop consistently.
- Calculate incremental ROI for every event. Strip out baseline sales the promotion would have generated anyway, subtract cannibalized volume from adjacent SKUs, and net out the post-promo dip where customers simply bought earlier than planned.
- Rank every event from best to worst. Sort by incremental ROI, not headline lift, across mechanic, account, and SKU.
- Isolate the bottom third. A practical rule among experienced analysts is to inspect the bottom third of ranked events for recoverable waste, then look for what the top third has in common, mechanic, retailer, or SKU profile, and try to replicate it.
- Size the reallocation. Move a bounded share of spend, not the whole budget, from the weak events into patterns resembling the top performers.
- Set a measurement window and re-run the cycle. Give the shift enough time to produce clean data, typically one full promotional cycle, before judging results.
The discipline is in the boundaries. Move too much spend at once and you lose the ability to tell which change caused which result.
Four Levers and the Waste Fingerprints Hiding in Your Data
Once you've ranked events, four levers determine where reallocated dollars actually go: the promotion mechanic itself (discount depth versus feature and display visibility), account mix, SKU mix, and timing or frequency.
Waste tends to show up in recognizable patterns once you know what to look for:
- Over-discounting past the elasticity curve. Depth beyond a certain point stops buying incremental volume and just erodes margin on units you'd have sold anyway.
- Repeated frequency compressing the baseline. Running the same promotion too often trains customers to wait for it, which quietly lowers your non-promoted baseline over time.
- Scattershot account support. Spend spread evenly across retailers regardless of their actual response rate, instead of concentrated where it earns the best incremental return.
- Deep TPRs that look strong on paper. Feature and display mechanics frequently outperform deep price cuts on incremental ROI once you account for sustain-lift ratio and the subsidy paid to customers who were buying anyway.
Pro Tip: Before you touch discount depth, check whether the promotion is actually visibility-starved. A modest discount paired with strong end-cap display often beats a deep discount with no display support at all.
On sizing, bounded reallocation of roughly 15 to 25% of budget per cycle preserves your ability to learn from the change instead of guessing at what caused it.
How Do You Actually Run a Bounded Optimization Cycle?
Turning the loop into a repeatable process means assigning clear ownership at each step, not just running the math once and hoping it sticks.
- Prep the data. Reconcile POS, depletions, deduction, and GL data into one dataset before you calculate anything. Build baselines using at least four to six quarters of history where seasonality allows.
- Rank and select candidates. Score every event on incremental ROI. Flag the bottom third as reallocation candidates and the top third as the target pattern.
- Size the shift and design the test. Cap the reallocation at 15 to 25% of the affected budget. Choose a control group of comparable accounts or SKUs that keep the old pattern, so you have something to compare against.
- Set governance and cadence. Commercial owns event selection, finance owns the ROI math and accrual tie-out, and analytics owns the ranking model and measurement design. Meet monthly during active cycles, quarterly for full retrospectives.
- Track the right KPIs. Blended incremental ROI, ROI dispersion across events, and the share of spend sitting in bottom-third events quarter over quarter.
Practitioners commonly target a 15 to 25% budget shift per cycle as the sweet spot between meaningful impact and preserving clean measurement. Go bigger and you risk conflating too many changes into one noisy result.
Which Tools Actually Support Trade Spend Optimization?
Four tool categories do the heavy lifting: TPM platforms for planning and settlement, TPO or simulation engines for scenario modeling, POS connectors for clean depletions data, and analytics layers that turn all of it into ranked, actionable output.
Scenario testing lets commercial teams compare margin and ROI outcomes before committing budget, which is the difference between optimizing on paper and optimizing after the fact when the money's already spent. Similarly, AI-driven forecasting and simulation can flag low-return promotions before they run, catching waste before it happens rather than diagnosing it three months later.
The decision rule is straightforward. If you already have clean data and a defined process, buy a platform and run it internally. If you have the data but lack the bandwidth or specialized modeling skill to build the ranking and simulation layer, that's where fractional advisory earns its keep. Cpgagent's platform pairs AI-driven analysis with fractional commercial leadership specifically to close that gap, compressing what typically takes an internal team two quarters to build into a pilot you can run in one.
The Bottom Line on Optimizing Trade Spend This Quarter
Start with three moves: fix your data integration so incremental ROI is calculable rather than estimated, rank last cycle's events by that ROI, and run one bounded reallocation, 15 to 25% of budget, into the patterns your top performers share.
Brands that run this loop consistently for a few cycles typically see blended ROI improve by a meaningful margin, not from cutting spend but from moving it toward what already works. The ceiling depends on how much waste was hiding in the data to begin with.
If your team lacks the internal capacity to build the ranking and simulation layer yourself, a platform-supported pilot is usually the fastest way to get a clean read on where your dollars are underperforming.
Getting Cross-Functional Buy-In for Trade Spend Changes
Trade spend optimization fails more often from organizational friction than from bad math. Sales teams that get evaluated on volume resist reallocation away from high-lift, low-ROI promotions because their scorecard rewards the wrong number. Finance teams that own the P&L want margin protected but rarely have visibility into which specific events are draining it.
The fix starts with shared metrics before you touch a single dollar. If sales, finance, and commercial analytics are optimizing against different numbers, no reallocation plan survives contact with the next planning cycle. Get agreement upfront that incremental ROI, not headline lift or volume, is the metric that decides which events get more budget and which get less.
Sequencing the rollout matters too. Piloting a bounded reallocation on a handful of accounts or SKUs, rather than announcing a company-wide policy shift, gives skeptical stakeholders a small, low-risk data point to react to instead of an abstract threat to their existing plans. When the pilot produces a clean ROI lift, that becomes the argument for scaling, not a slide deck built on projections.
Ownership needs to be explicit from day one. Commercial teams should own which events get flagged for reallocation, finance should own the ROI calculation and sign off on accrual impact, and analytics should own the ranking model itself. Without a named owner for each piece, the loop quietly stalls the first time a retailer pushes back on reduced support, and nobody has the authority to hold the line.
What Do Real Trade Spend Optimization Wins Actually Look Like?
The pattern that shows up repeatedly across brands running disciplined TPO cycles isn't a dramatic overhaul. It's a series of small, compounding corrections applied consistently over several planning periods.
A mid-sized beverage brand running deep TPRs across most of its retail accounts is a common starting point. Ranking events by incremental ROI typically reveals that a meaningful share of "successful" promotions, judged by headline lift, are actually underwater once cannibalization and post-promo dip get subtracted out. The bottom-third events usually cluster around one pattern: deep discounts on SKUs that already have strong household penetration, where the promotion mostly subsidizes loyal buyers rather than winning new ones.
The reallocation that tends to work isn't cutting that spend entirely. It's shifting a bounded share of it toward feature and display support on the same SKUs, or toward accounts where the same discount depth has historically produced a cleaner incremental lift. Feature and display mechanics often outperform deep discounts precisely because they don't train customers to wait for the next price cut.
The lesson that generalizes across categories: the biggest wins rarely come from a single brilliant reallocation. They come from running the measure-reallocate-remeasure loop every cycle, long enough that the waste fingerprints get systematically identified and corrected instead of rediscovered from scratch each year.
How Should You Forecast Promotional Effectiveness?
Forecasting promotional lift starts with the same baseline discipline that incremental ROI measurement requires. Without a clean, seasonally-adjusted baseline for what a SKU would sell without promotion, any forecast of lift is really just a guess wearing a spreadsheet.
The strongest forecasting approaches blend historical event performance with scenario simulation. Rather than assuming next quarter's TPR will perform like an average of the last eight, simulation engines let teams model specific combinations of mechanic, depth, and account before committing budget, comparing projected margin and ROI outcomes across several scenarios side by side.
Elasticity modeling matters more than most planning calendars give it credit for. A discount depth that drove strong incremental volume at 20% off doesn't necessarily scale linearly to 30% off, and plenty of brands overspend by assuming it does. Forecasting models that account for diminishing returns on discount depth catch this before the budget is committed, not after the promotion underperforms.
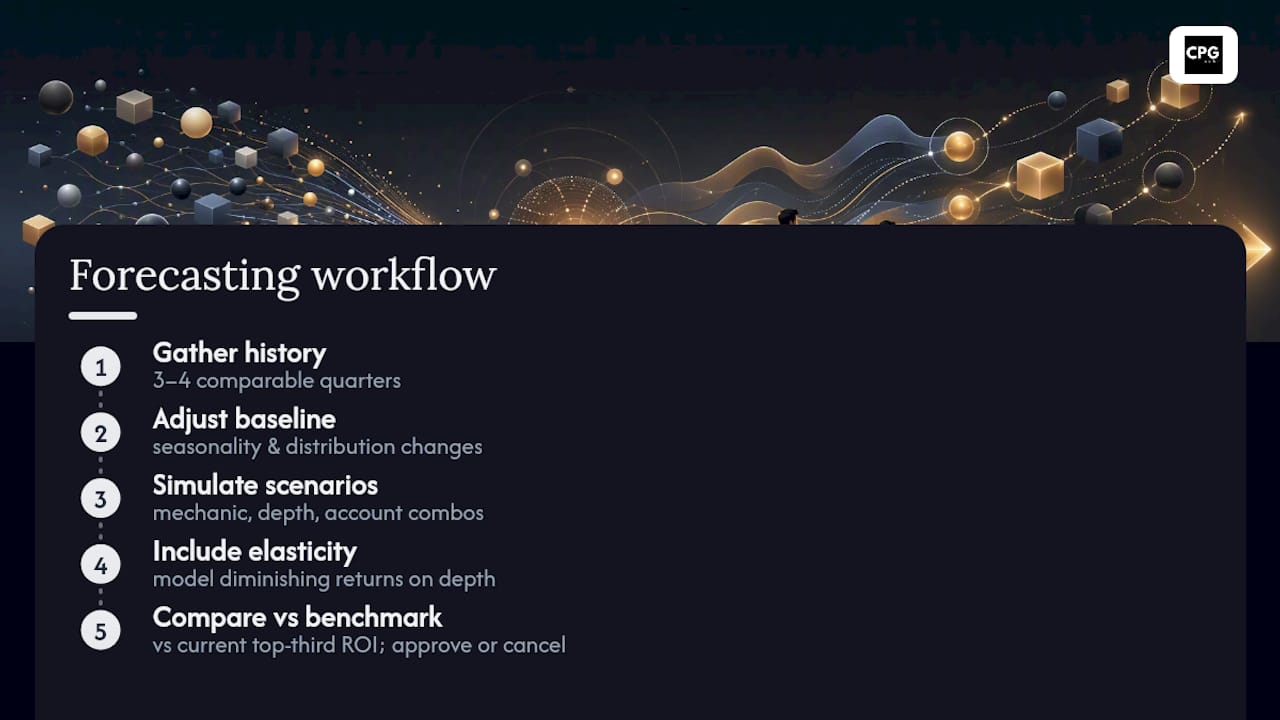
The practical forecasting workflow worth building: pull three to four quarters of comparable event history, adjust for seasonality and any distribution changes, run the proposed scenario through a simulation layer if one is available, and compare the projected incremental ROI against your current top-third benchmark before approving spend. If the forecast doesn't clear that bar, the event probably shouldn't run as planned. This is also where FMCG marketing calendar planning intersects directly with trade spend forecasting, since timing and frequency assumptions feed straight into the projection.
Where Does Competitive Intelligence Fit Into Trade Spend Decisions?
Trade spend decisions made in isolation from what competitors are doing on shelf are decisions made half-blind. A promotion that looked strong in isolation can underperform badly if a competitor ran a deeper discount the same week, and a promotion that looked mediocre might actually have held share against aggressive competitive pressure.
Competitive intelligence for trade spend purposes means tracking competitor promotion frequency, discount depth, and display activity at the account level, then layering that against your own event performance. If your incremental ROI on a given SKU dropped sharply in a period when a direct competitor ran a matching promotion in the same accounts, that's a different diagnosis than a promotion that simply failed to move volume on its own.
This intelligence should feed directly into event ranking and reallocation decisions, not sit in a separate competitive report nobody reads during planning. A weak-looking event that actually held share against heavy competitive pressure shouldn't get flagged for reallocation the same way a genuinely underperforming event should. Building this layer into the analytics stack takes more data collection than most brands initially have set up, and it's often the piece that separates a mature TPO program from a purely internal one.
How Do You Prevent Trade Spend Leakage and Stay Compliant?
Revenue leakage in trade spend usually isn't fraud. It's slow accumulation of small process failures: deductions that don't match approved promotion terms, off-invoice discounts applied without proper backup documentation, and accruals that drift from actual settlement amounts over several quarters.
Compliance starts with clean approval workflows before spend commits, not audits after the fact. Price floor management and approval triggers built into planning systems catch a discount that exceeds authorized depth before it goes to a retailer, rather than catching it three months later during deduction reconciliation.
The audit trail matters as much as the approval step. Every promotion needs backup documentation tying the planned event to the actual invoice and deduction, so finance can verify that what a retailer deducted actually matches what was authorized. Without that paper trail, deduction disputes become guesswork, and brands routinely end up eating unauthorized deductions simply because they can't prove what was approved.
A quarterly reconciliation cadence between planned accruals and actual settlements is the single highest-leverage habit for catching leakage early. Brands that only reconcile annually often discover a full year of small discrepancies compounding into a real margin hit, by which point the retailer relationship and the internal budget conversation both get harder. Tie this reconciliation directly into the same governance cadence used for the optimization loop itself, since the same finance and commercial owners are already reviewing event performance on that schedule.
Why Steady Cycles Beat Big Annual Overhauls
The brands that make real progress on trade spend rarely do it through one dramatic overhaul. They run small, bounded cycles, quarter after quarter, and let the ranking data compound. A 20% reallocation you can actually measure beats a 100% redesign you can't attribute anything to.
Most stalled TPO programs aren't stuck on strategy. They're stuck on capacity, nobody owns the ranking model, nobody has time to build the simulation layer. That's precisely the gap fractional advisory exists to close.
Treat this as routine commercial governance, not a special initiative. The loop only works if someone runs it every cycle.
— Matthew
How Cpgagent Helps You Optimize Trade Spend Faster
Cpgagent is the practical alternative to building a full TPO stack in-house before you've proven the reallocation model works. Instead of a multi-quarter internal build, you get AI-driven scenario analysis and fractional commercial leadership that plugs directly into your existing data, cutting the time between "we think we're overspending on TPRs" and "here's the reallocation that fixed it."
A pilot engagement typically runs one bounded reallocation cycle: clean up your baseline data, rank last quarter's events by incremental ROI, and test a 15 to 25% shift into higher-performing patterns. You get an early ROI signal without committing to a full platform buildout, and the fractional advisory piece means you're not asking an already-stretched commercial team to also become trade analytics experts overnight.
Visit the Cpgagent platform to see the tool categories in action and request a pilot scoped to your current data setup.
Sources
- Trade promotion management software | AI optimization | Visualfabriq
- Trade Spend Optimization: More From Every Dollar — Scout
FAQ
What Is TPM in CPG?
Trade promotion management (TPM) is the system CPG companies use to plan, execute, and settle trade promotions, covering budgeting, deduction tracking, and accrual reconciliation.
What Is Trade Spend?
Trade spend is the money CPG brands pay retailers to support promotions, including temporary price reductions, feature and display placement, off-invoice discounts, rebates, and slotting fees.
What Is TPM in FMCG?
TPM in FMCG works the same way it does in CPG: it's the operational system for planning and settling trade promotions, distinct from trade promotion optimization (TPO), which analyzes that data to decide where spend should go next.
How Can I Optimize My Marketing Spend?
A platform like Cpgagent can help run that analysis without a multi-quarter internal build.
How Often Should I Run a Trade Spend Optimization Cycle?
Most teams run the measure-reallocate-remeasure loop every promotional planning period, typically quarterly, with a full governance retrospective on the same cadence.