

TL;DR:
- Sell-through rate measures the percentage of inventory sold during a specific period, indicating sales velocity. Monitoring SKU-level sell-through helps optimize reorders and prevent excess stock, with benchmarks typically between 70% and 80%. Using accurate data and consistent calculations enables better inventory decisions and improved profit margins.
Your retail sell-through rate (STR) is the percentage of inventory you sold during a specific period, measured against what you received or had on hand. The canonical formula is simple: (Units Sold ÷ Units Received or Available) × 100. A high STR means your buy was well-calibrated and cash is moving; a low one means capital is sitting on shelves, and you're likely heading toward a markdown. Every reorder, cancellation, and pricing decision you make gets sharper when this number is in front of you.
Table of Contents
- What does sell-through rate actually measure?
- How to calculate sell-through rate (with a worked example)
- What counts as a good sell-through rate?
- Which time window should you measure?
- How merchandisers use STR to make real decisions
- Common pitfalls that distort your sell-through numbers
- How to improve sell-through rate without sacrificing margin
- Sell-through vs. sell-out vs. inventory turnover: which metric do you need?
- Tools and tracking systems for reliable STR monitoring
- How a CPG analytics workflow applies STR in practice
- Key Takeaways
- The metric most brands underuse
- Cpgagent turns sell-through data into decisions, automatically
- Useful sources
- FAQ
What does sell-through rate actually measure?
At its core, STR measures the velocity of a specific buy or SKU within a defined period. It tells you how quickly inventory converts to revenue, not just whether it eventually sold.
Two variants matter in practice:
- Units-based STR: Counts physical units sold versus units received or on hand. Best for most operational decisions.
- Dollar-value STR: Measures revenue generated versus the retail value of inventory received. Useful when comparing SKUs with very different price points, since a high-unit STR on a $3 item and a low-unit STR on a $40 item tell very different margin stories.
The denominator choice matters just as much as the formula itself. Use units received as your denominator when you're evaluating a specific product launch or buy — it tells you how well that particular purchase decision performed. Switch to stock-on-hand for evergreen SKU health monitoring, where you want a rolling picture of what's moving versus what's accumulating.
Pro Tip: If you're tracking a seasonal launch, always use units received. Using stock-on-hand mid-season can inflate your STR if early receipts already sold through, masking a slow tail.
How to calculate sell-through rate (with a worked example)
The formula has two common versions depending on your denominator:
Version 1 (launch/buy evaluation): STR = (Units Sold ÷ Units Received) × 100

Version 2 (evergreen monitoring): STR = (Units Sold ÷ Units on Hand at Period Start) × 100
Step-by-step calculation
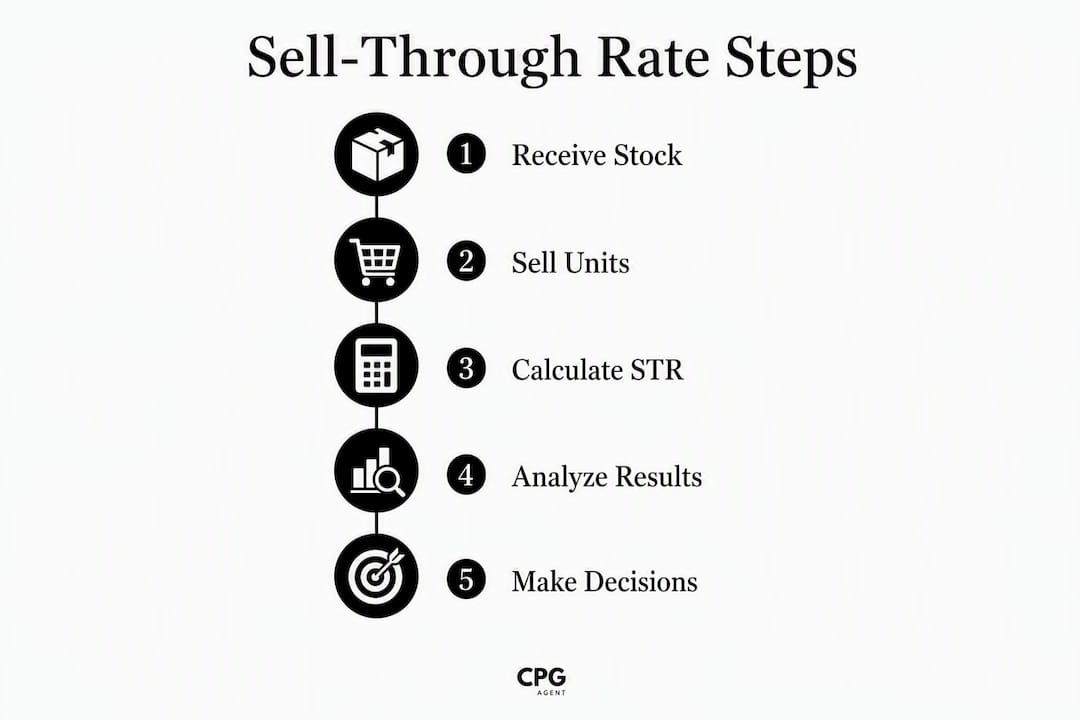
- Define your measurement period (30 days is a standard monitoring cycle).
- Pull total units received during that period (or opening inventory for Version 2).
- Pull total units sold in the same period.
- Exclude returns from units sold; add returns back to available inventory.
- Divide units sold by units received (or on hand), then multiply by 100.
Worked example:
| Variable | Value |
|---|---|
| Units received (buy) | 200 |
| Units sold in 30 days | 140 |
| Returns | 10 |
| Net units sold | 130 |
| STR (units received basis) | 65% |
| Opening stock on hand | 220 |
| STR (stock-on-hand basis) | 59% |
The same SKU reads differently depending on which denominator you use. That's not a flaw — it's information. The 65% tells you how the buy performed; the 59% tells you where inventory health stands today.
Spreadsheet setup: Build columns for SKU, period start date, units received, opening stock, units sold, returns, transfers in/out, and a calculated STR field. A reliable calculator must account for returns and inter-store transfers to avoid miscounts. Handle staggered receipts by locking the denominator to the period's opening receipt total, not a running cumulative.
What counts as a good sell-through rate?
Benchmarks vary more than most guides admit, but here's a working framework:
- Below 40%: Excess stock or weak demand. Investigate before the next reorder and consider promotional support or markdown.
- 40%–70%: Acceptable for many categories, but watch the trend. Flat or declining STR in this band often signals assortment or placement issues.
- 70%–80%: The commonly cited healthy range for general retail; a reasonable target for most SKUs.
- Above 80%: Strong performance. For some categories, this signals a risk of stockout, so reorder timing becomes critical.
Category benchmarks narrow this further. Apparel typically runs 65%–85%; beauty and consumables often land between 75%–90% given faster replenishment cycles and higher purchase frequency.
Three caveats worth keeping in mind:
- Seasonality distorts everything. A 45% STR on a holiday SKU in week one of a 12-week season is not a failure. The same number in week ten is a problem.
- Promotional periods inflate STR temporarily. A spike during a BOGO event doesn't mean the base velocity improved.
- Lifecycle stage matters. New launches often start below benchmark and build; end-of-life SKUs should be running high STR as you clear out remaining stock.
Which time window should you measure?
The measurement period you choose shapes every decision that follows. Pick the wrong window and you'll act on noise.

| Window | Best for | Watch out for |
|---|---|---|
| Weekly | Fast fashion, perishables, high-velocity FMCG | Too granular for slow movers; distorted by day-of-week effects |
| Monthly (30-day) | Standard monitoring for most CPG and general retail | Misses intra-month spikes from promotions |
| Seasonal/campaign | Launch evaluation, seasonal buys, promotional periods | Requires clean start/end dates tied to receipt dates |
A monthly monitoring cadence works for many retail operations. Align your measurement window with your purchase order receipt dates and reorder lead times to generate timely signals for reorder decisions.
Pro Tip: When receipts arrive in multiple shipments across a period, lock your denominator to the first shipment date and run a separate STR calculation for each receipt tranche. Blending them into one number hides which part of the buy underperformed.
How merchandisers use STR to make real decisions
STR without a decision rule is just a number. Here's how to wire it into your operations:
Best practices suggest staging action thresholds for STR reflecting relative performance: high STR may trigger reorder consideration; midrange STR warrants monitoring; low STR at key points could indicate promotional support or markdown actions; very low or stale inventory merits reducing future orders or discontinuation.
The workflow is: monitor → evaluate against threshold → act. The key is setting thresholds before the season starts, not reacting emotionally mid-season when markdowns feel painful.
A few additional rules that protect margin:
- Always check whether a low STR is channel-specific before marking down across all doors.
- Reallocate inventory between stores before triggering a sitewide markdown.
- Tag promotional units separately so a promo-driven STR spike doesn't reset your baseline expectations.
Common pitfalls that distort your sell-through numbers
Even a well-built STR formula produces misleading numbers when the underlying data is dirty. The most common distortions:
- Returns counted as unsold inventory: Returns should reduce net units sold, not inflate available inventory. Separate the two in your data model.
- Inter-store transfers: Moving units between locations mid-period changes both the numerator and denominator. Track transfers explicitly and decide whether to include or exclude them from each store's STR.
- Staggered receipts: Receiving 100 units in week one and 100 more in week three of a 30-day period inflates the denominator if you count both. Lock the denominator at period start.
- Bundle SKUs: A bundle that includes a slow-mover and a fast-mover will show a blended STR that hides the slow component. Run STR at the component level.
- Channel mix: An omnichannel STR that blends e-commerce and brick-and-mortar can mask a failing store channel behind strong online velocity.
- Promotional inflation: A flash sale in the final week of a period can push STR above benchmark, making a mediocre SKU look healthy.
Running STR at the SKU level rather than blended across categories is the single most effective way to catch these distortions. A blended category STR of 68% can hide three SKUs running at 20% and two running at 95%.
How to improve sell-through rate without sacrificing margin
Ranked from highest impact to lowest, with margin preservation in mind:
- Prune the assortment. Cut SKUs with chronic low STR before the next buy. Fewer SKUs with higher velocity beats a wide assortment with dead weight.
- Localize the assortment. Allocate SKUs to stores where the category historically moves fastest. A SKU with a 40% STR chain-wide might run at 75% in three specific doors.
- Adjust replenishment cadence. For high-STR SKUs, shorten the reorder cycle to reduce stockout risk. For low-STR SKUs, extend it to avoid compounding the problem.
- Run targeted promotions before markdowns. A loyalty-member offer or a display feature costs less margin than a sitewide discount. Test it on a subset of stores first.
- Optimize price architecture. Small price reductions on slow movers often lift STR more than large blanket discounts. Test a 10% reduction on a limited set of doors before rolling out.
- Improve display and placement. Eye-level placement and end-cap features can lift STR on a struggling SKU without touching price. An AI retail shelf audit can identify placement gaps at scale.
- Reduce return rates. High return rates suppress net STR. Investigate whether sizing, packaging, or product description issues are driving returns and fix the root cause.
Pro Tip: Before rolling out any tactic chain-wide, run a two-store A/B test for two to four weeks. A localized test costs almost nothing and tells you whether the tactic actually moves STR or just creates noise.
Sell-through vs. sell-out vs. inventory turnover: which metric do you need?
These three metrics are often used interchangeably. They shouldn't be.
| Attribute | Sell-Through Rate | Sell-Out | Inventory Turnover |
|---|---|---|---|
| Timeframe | Defined period (weekly/monthly/seasonal) | Point-in-time or period | Annual (usually) |
| Best unit | Units or dollars per SKU | Units at retail | COGS ÷ average inventory |
| Best use-case | Launch evaluation, buy performance, markdown timing | Retailer reporting to supplier | Aggregate stock efficiency |
| Leading or lagging | Leading (near-term signal) | Leading | Lagging (backward-looking) |
STR is a leading indicator at the SKU or buy level. Inventory turnover is a lagging aggregate that tells you how efficiently you replaced stock over a year. Relying on turnover alone can mask a product launch that's failing in real time. Sell-out is the term suppliers and retailers use when reporting sales at the consumer level (what left the shelf), as opposed to sell-in (what the retailer bought from the supplier). STR and sell-out measure similar things but from different vantage points and with different denominators.
Tools and tracking systems for reliable STR monitoring
You don't need an enterprise system to track STR well. You need clean data and consistent rules.
Minimum spreadsheet fields:
- SKU ID and description
- Period start and end dates
- Units received (by receipt date)
- Opening stock on hand
- Units sold (gross)
- Returns
- Transfers in/out
- Net units sold (calculated)
- STR calculation (formula cell)
What to look for in a POS or inventory management system:
| Feature | Why it matters for STR |
|---|---|
| Real-time sales logging | Enables weekly STR pulls without manual data entry |
| Receipt date tracking | Lets you lock the denominator accurately |
| Return and transfer logging | Prevents double-counting in the STR formula |
| SKU-level reporting | Avoids blended STR that hides slow movers |
| Automated alerts | Flags SKUs crossing low or high STR thresholds |
Set alert rules to monitor SKUs crossing certain performance thresholds, such as low STR mid-period indicating promotional support need, and very high STR late in selling period prompting reorder checks. Most modern POS platforms (Square for Retail, Lightspeed, Shopify POS) support custom reporting that can approximate these alerts even without a dedicated BI layer.
How a CPG analytics workflow applies STR in practice
A practical STR workflow involves weekly SKU-level analysis to identify underperforming units for targeted action including inventory reallocation and promotional tactics, avoiding misleading chain-wide averages that mask distribution problems.
That kind of SKU-level diagnosis, combined with fractional advisory to act on it quickly, is where CPG brands expand into new retailers with confidence rather than guesswork.
Key Takeaways
Sell-through rate is the most direct measure of inventory buy quality, especially when analyzed at the SKU level to avoid misleading averages. Key points include matching denominator to goal, monitoring regularly, timely markdown consideration for stale inventory, and leveraging automation platforms for tracking and alerts.
The metric most brands underuse
Most inventory teams I see track sell-through at the category level and wonder why their markdown rate keeps climbing. The answer is almost always the same: the category average is fine, but three SKUs are quietly destroying the economics of the whole buy.
The fix isn't a better formula. It's discipline around SKU-level analysis and pre-set decision rules. The teams that get this right don't wait until inventory is 120 days old to act. They have a threshold, they have a workflow, and they execute it without debate.
The other mistake I see constantly is choosing the wrong denominator. Using stock-on-hand for a launch evaluation will almost always make the buy look better than it was, because early sell-through depletes the denominator before you've had a chance to assess the full period. Lock the denominator to units received at the start of the period and don't touch it.
Finally, don't let a high STR lull you into complacency. A 90% STR with three weeks left in the season means you're likely leaving revenue on the table from stockouts. The goal isn't the highest possible STR — it's the STR that maximizes margin across the full selling period.
Cpgagent turns sell-through data into decisions, automatically
Tracking STR in a spreadsheet works until it doesn't. When you're managing dozens of SKUs across multiple doors and channels, the manual pull-and-review cycle breaks down exactly when you need it most — mid-season, when every week of delay costs margin.

Cpgagent's platform automates SKU-level STR tracking, flags underperforming inventory before it becomes dead stock, and supports the kind of rapid experiments — limited-store promos, price tests, placement changes — that move the needle without committing to a chain-wide markdown. For brands that want senior strategic input alongside the data, the fractional CMO advisory service translates STR signals into buy decisions and assortment strategy. If your current process involves a weekly spreadsheet and a gut check, there's a faster route. See what the platform does for CPG and FMCG brands at every stage, or book an advisory session to get a read on your current inventory position.
Useful sources
- Shopify: Sell-Through Rate — How to Calculate and Improve It: Clear formula walkthrough and practical improvement tactics for retail operators.
- EightX: What Is Sell-Through Rate: Strong on denominator choices, SKU-level analysis, and category benchmarks.
- Lightspeed: Sell-Through Rate Definition, Formula, and Importance: Covers monitoring cadence, the 180-day stale inventory rule, and margin preservation.
- FitSmallBusiness: What Is Sell-Through Rate (+ Free Calculator): Includes a free calculator and benchmark guidance with category caveats.
- OmniCalculator: Sell-Through Rate Calculator: Quick calculator with field guidance for returns and transfers.
- Corporate Finance Institute: Sell-Through Rate Overview: Concise conceptual treatment of STR as a leading indicator versus inventory turnover.
- Wikipedia: Sell-Through: Useful for understanding sell-through versus sell-in terminology and historical retail context.
FAQ
What is a good sell-through rate for a retail store?
A sell-through rate of 40%–80% is the commonly cited healthy target for general retail, though beauty and consumables often run 75%–90% and apparel ranges from 65%–85% depending on the season and category.
What does a 50% sell-through rate mean?
An STR at around the middle of the percentage scale means a moderate portion of inventory sold during the measurement period. It generally falls within the acceptable range for many categories but warrants monitoring, especially if the trend is flat or declining rather than building toward the end of the selling period.
How do you calculate your sell-through rate?
Divide units sold by units received (or units on hand at the start of the period), then multiply by 100. For a launch, use units received as the denominator; for ongoing monitoring, use opening stock on hand.
What does "sell-thru rate" mean in retail?
Sell-thru rate is shorthand for sell-through rate — the percentage of inventory that sold during a defined period. It's a leading indicator of buy performance and demand velocity, distinct from inventory turnover, which is a broader annual metric.
How is sell-through different from inventory turnover?
Sell-through is a leading, SKU-level indicator measured over short periods (weekly or monthly); inventory turnover is a lagging, aggregate metric typically calculated annually that can mask individual SKU problems behind a healthy-looking average.