

TL;DR:
- Trade spend efficiency measures the incremental gross profit generated per dollar of trade investment. It is best calculated by dividing incremental gross profit by actual settled trade spend to accurately assess promotional ROI. Improving settlement discipline and reallocating spend toward higher-return events can significantly boost profit margins.
Trade spend efficiency measures the incremental output — sales or gross profit — your brand earns per dollar of trade investment. Two formulas matter immediately: the net-sales-based ratio (Net Sales ÷ Trade Spend) tells you your gross-to-net rate, while the more honest measure is Incremental Gross Profit ÷ Trade Spend, which isolates what the promotion actually generated above baseline. If you can only do one thing today, measure promotional lift in units, convert those incremental units to incremental gross profit, then divide by actual settled trade spend. That single number tells you whether the event paid for itself.
Trade spend typically runs a significant portion of gross sales for most CPG brands, making it the largest discretionary P&L line after COGS. At that scale, even a modest improvement in efficiency recovers real margin dollars. NielsenIQ defines trade efficiency as the promotional lift generated per dollar spent discounting an item, with a value above $1 signaling a break-even or better return and anything below $1 meaning the promotion drove some lift but did not cover its cost.
Table of Contents
- What trade spend is and where it lives on the P&L
- What objective are you actually running the promotion for?
- Core metrics for measuring trade spend efficiency
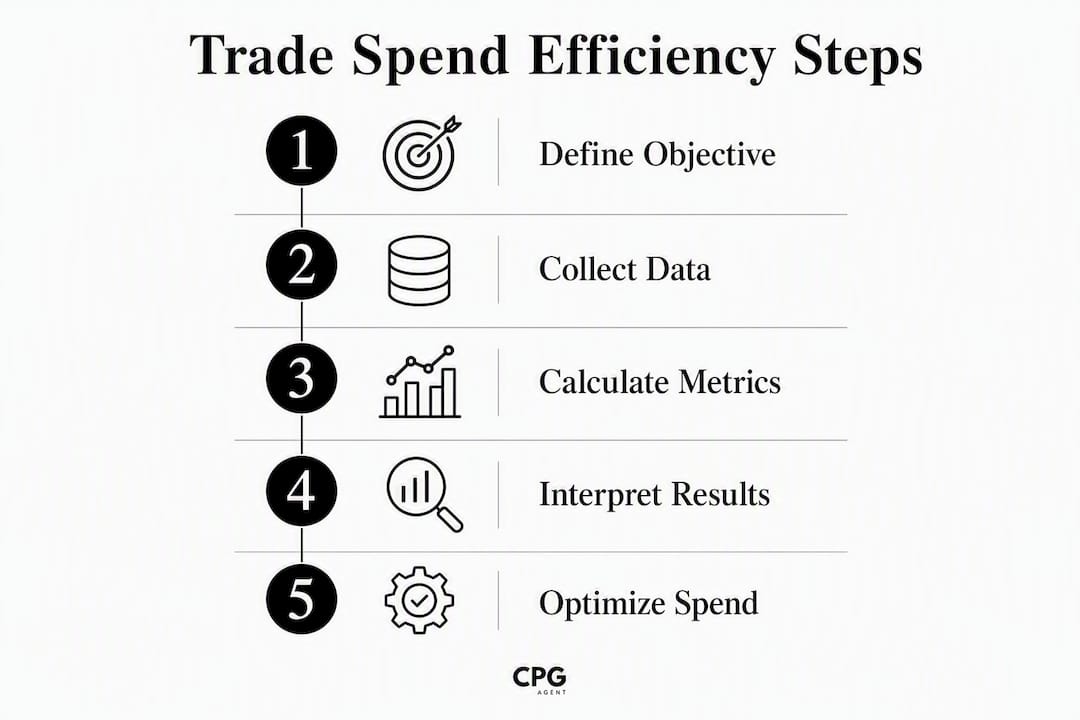
- How to calculate trade spend efficiency step by step
- Common measurement challenges and how to fix them
- How to interpret efficiency numbers and what "good" actually looks like
- Where trade spend sits on the P&L and why it moves the profit needle
- Practical levers to improve trade spend efficiency
- Key Takeaways
- The metric most teams are measuring wrong
- Cpgagent helps you run the measurement loop faster
- Useful sources and further reading
- FAQ
What trade spend is and where it lives on the P&L
Trade spend is the money a manufacturer pays retailers or distributors to secure price, placement, or merchandising support. It is not advertising. It is not brand marketing. It is the commercial investment that funds the conditions under which a consumer can actually find and buy your product.
Common forms include:
- Off-invoice allowances: A per-case discount deducted at the time of purchase order.
- Billbacks and chargebacks: Allowances paid after the fact, triggered by retailer performance or scan data.
- Feature and display fees: Payments for ad circular placement, end-cap, or in-store display execution.
- Slotting and listing fees: One-time or annual fees to secure shelf placement or a new SKU listing.
- Co-op advertising: Shared funding for retailer-produced media that features your brand.
- Scan-down protection: Reimbursement to the retailer for the difference between everyday and promoted shelf price.
- Free fills and samples: Product provided at no charge to seed a new account or reset.
On the P&L, trade spend sits in the gross-to-net deductions layer, reducing reported revenue before you ever reach gross margin. The structure runs: Gross Sales → Trade Deductions → Net Sales → COGS → Gross Profit. That placement matters because every dollar of trade spend reduces the revenue base on which gross margin percentage is calculated, which is why finance teams watch the trade rate closely.
What objective are you actually running the promotion for?

One KPI does not fit every promotion. Before measuring efficiency, the team needs to agree on what the event was supposed to accomplish, because the right readout changes completely depending on the answer.
Common objectives and their recommended primary KPIs:
Drive trial: New households matter more than velocity. Track household penetration and repeat purchase rate in the weeks following the event, not just promoted volume.
Accelerate velocity: Incremental units per store per week during the promotional window is the right primary metric. Pair it with incremental gross profit per trade dollar to confirm the velocity gain was worth the cost.
Defend or expand distribution: ACV-weighted distribution per dollar of slotting or listing investment tells you whether the placement cost was proportionate to the sales opportunity it unlocked.
Protect pricing or premium positioning: A promotion that lifts short-term volume but trains consumers to wait for a deal is destroying long-term brand equity. Watch post-event baseline velocity and everyday price realization. If baseline velocity drops after a deep-discount event, the promotion was efficient on paper and destructive in practice.
Clear inventory: Here, efficiency is secondary to speed. The KPI is days of supply reduced, and the acceptable ROI threshold is lower because the alternative is write-off.
Misaligning objective and KPI is one of the most common measurement errors in CPG trade. A brand running a trial-driving event but measuring it on total promoted volume will always look better than it actually performed.
Core metrics for measuring trade spend efficiency
The table below covers the metrics RGM and trade marketing teams actually use, with formulas, best use cases, and the limitation each carries.
| Metric | Formula | Best Use Case | Key Limitation |
|---|---|---|---|
| Trade Load (Net Sales Efficiency) | Net Sales ÷ Trade Spend | Tracking gross-to-net rate over time | Reflects rate movement, not true incremental impact |
| Incremental Sales (Promo Lift) | Promoted Velocity − Baseline Velocity | Measuring volume response to a promotion | Requires reliable baseline; sensitive to seasonality |
| Incremental GP per Trade Dollar | Incremental GP ÷ Trade Spend | Primary efficiency KPI for event-level ROI | Requires accurate COGS and settled spend data |
| Promo ROI | (Incremental GP − Trade Spend) ÷ Trade Spend | Comparing events on a return basis | Can be gamed by choosing a low baseline period |
| Cost per Incremental Dollar (CPR) | Trade Spend ÷ Incremental Revenue | Comparing cost of generating $1 of incremental revenue | Ignores margin; misleading for low-margin SKUs |
| ACV-Weighted Distribution per Dollar | ACV Points Gained ÷ Trade Spend | Evaluating slotting or listing investment | Lags in data; ACV gains take time to appear in syndicated feeds |
The incremental distinction is non-negotiable. Incremental GP per trade dollar only counts sales above what would have happened without the promotion. Counting total promoted volume as the return is one of the most persistent errors in CPG trade measurement, and it systematically overstates efficiency.
Worked example: A brand runs a 15% TPR at a regional grocery chain for four weeks.
- Baseline velocity: 200 units per store per week across 80 stores
- Promoted velocity: 320 units per store per week
- Incremental units: (320 − 200) × 80 stores × 4 weeks = 38,400 units
- Gross profit per unit: $2.10
- Incremental GP: 38,400 × $2.10 = $80,640
- Actual settled trade spend: $52,000
- Incremental GP per trade dollar: $80,640 ÷ $52,000 = $1.55
A result above $1.00 means the event covered its cost and generated incremental profit. The NielsenIQ CPG dictionary frames this threshold the same way: above $1 breaks even, higher is better, below $1 means the promotion drove some lift but did not pay back.
How to calculate trade spend efficiency step by step
Running this calculation consistently across events requires a repeatable process. Here is the checklist:
- Measure promoted velocity vs. baseline — Pull retailer POS or syndicated scan data (NielsenIQ, Circana) for the event window and the baseline period.
Pro Tip: Keep one event record alive from planning through settlement, with fields for event ID, account, SKU, mechanic, planned spend, accrued spend, actual settled spend, incremental units, and incremental GP. Teams that skip this step spend weeks reconstructing data at quarter-end instead of running the next optimization loop.
For data source selection: use retailer POS for speed, syndicated scan data for category context, and matched-market or matched-store tests when you need to isolate the effect of a new mechanic from external noise. Store tests are slower but produce the cleanest incrementality read.
Common measurement challenges and how to fix them
Even teams with good intentions produce unreliable efficiency numbers. These are the predictable failure points:
- Attribution ambiguity: When a feature, display, and TPR run simultaneously, it is impossible to know which mechanic drove the lift without a factorial test design. Mitigation: run single-mechanic tests periodically to build a mechanic-level response library.
- Cannibalization and halo effects: A promoted SKU may pull volume from adjacent sizes or flavors in the same family. Measure the full SKU family, not just the promoted item, and net out cannibalized units before claiming incremental volume.
- Accrual vs. settled spend drift: Brands accrue estimated liabilities at plan time and settle via deductions later, and the two numbers frequently diverge. Reconcile accruals to settled deductions weekly, not quarterly.
- Missing deduction matching: Unmatched deductions can run 5–10% of gross trade spend for brands without tight settlement processes. That leakage hits margin directly and silently. Fix settlement discipline before changing promo mechanics.
- Seasonality and sample size: A four-week event in a seasonal category will look different in March than in October. Always compare to the same period in a prior year or use a matched-control group.
- Retail reporting lags: Syndicated data typically lags two to four weeks. Build that lag into your post-event review calendar so you are not drawing conclusions from incomplete data.
The operational fix that returns the most margin fastest is settlement discipline. Reconciling accruals to actuals often recovers more gross profit in the near term than any change to promotional mechanics.
How to interpret efficiency numbers and what "good" actually looks like

There is no universal efficiency target that applies across every CPG category, and chasing one is a mistake. A $1.55 incremental GP per trade dollar is excellent for a low-margin commodity snack and merely adequate for a premium supplement with 65% gross margins.
Directional benchmarks to orient your numbers:
- Trade rate (trade spend as a percentage of gross sales): 15–25% is the typical range across CPG, per industry benchmarks. Brands at the high end of that range have less room to absorb inefficiency.
- Deduction leakage: 5–10% of gross trade spend for brands without mature settlement processes. Closing that gap is the fastest path to margin recovery.
The right interpretive frame is relative and marginal, not absolute. Compare your blended ROI by account cohort and by event type, then ask the marginal question: what happens to incremental return if you shift $1 from your lowest-performing event to your highest-performing one? When marginal returns are equalizing across your portfolio, you are close to an efficient allocation. When they are wildly uneven, you have a reallocation opportunity.
NielsenIQ's syndicated benchmarks are the standard reference for category-level norms on promotional lift and trade rate. Use them to calibrate whether your brand's efficiency is above or below category average before drawing conclusions about your promotional strategy.
A practical interpretive rule: grade your event portfolio by ROI, identify the bottom third, and treat those events as candidates for restructuring or elimination before you touch the top third.
Where trade spend sits on the P&L and why it moves the profit needle
The P&L structure for a CPG brand looks like this:
Gross Sales → Trade Deductions → Net Sales → COGS → Gross Profit
Trade spend reduces the revenue line before gross margin is calculated. That means a 1-point improvement in trade efficiency does not just save a dollar of spend; it recovers a dollar of gross profit directly. At scale, that math compounds quickly.
Consider a brand with $30M in gross sales running a 20% trade rate. That is $6M in trade spend annually. A 1-point improvement in blended incremental GP per trade dollar, applied across the full portfolio, translates to hundreds of thousands of dollars in recovered gross profit without adding a single new distribution point or launching a new SKU.
When presenting trade efficiency results to finance or a CFO, lead with one metric: incremental gross profit recovered per trade dollar, compared to the prior period or prior year. That framing connects directly to the gross margin line they are watching and avoids the confusion that comes from presenting multiple ratios simultaneously. Pair it with the trade rate trend (is gross-to-net improving or deteriorating?) and you have a two-number story that finance can act on.
The accrual-versus-actual gap also shows up on the P&L as margin volatility. When accrued estimates drift from settled deductions, gross profit swings quarter to quarter in ways that have nothing to do with actual commercial performance. Tight settlement discipline stabilizes the P&L and makes efficiency trends readable.
Practical levers to improve trade spend efficiency
Optimization is reallocation, not reduction. The goal is to move the same budget toward higher-return events, not to cut spend and hope margin follows.
High-impact levers to pull:
- Reduce discount depth on low-incrementality events. Deep everyday discounts often pull forward purchases from loyal buyers rather than recruiting new ones. Narrower discounts with stronger display execution frequently outperform on incrementality.
- Shift from broad TPR to targeted feature/display. Feature and display events tend to drive higher incremental lift per dollar in categories where visibility drives trial, because they reach shoppers who were not already planning to buy.
- Optimize account mix. Not every retailer delivers the same incremental GP per trade dollar. Identify your top two or three accounts by efficiency ratio and weight future investment toward them.
- Use SKU-level targeting. Promoting your hero SKU in a new account is different from promoting a slow-moving SKU to clear inventory. Keep those budgets and ROI targets separate.
- Run test-and-learn cycles. Introduce one mechanic change per event cycle, measure the result, and carry the learning forward. Quarterly optimization loops compound faster than annual resets because each pass builds on the prior one.
- Strengthen settlement and execution evidence. Require photo proof of display execution before approving billback payments. Disputes resolved in your favor are immediate margin recovery.
- Renegotiate display terms as fixed fees tied to measured lift. Moving from open-ended co-op commitments to performance-linked fixed fees aligns retailer incentives with your efficiency goals.
Two tactical examples worth running this quarter: First, identify your 10 lowest-ROI events from the past two cycles and reallocate 15–25% of that budget to a targeted display test in the same accounts. Re-measure after one cycle. Second, pull your settlement reconciliation for the last quarter and flag every deduction that lacks a matched event record. The dollar value of those unmatched deductions is your immediate recovery opportunity.
Cross-functional alignment matters here. Sales teams protect retailer relationships and resist pulling spend. Finance teams want margin recovery now. Trade marketing sits in the middle. The most effective framing for internal alignment is to present reallocation as a test, not a cut. Propose a 90-day experiment with a defined re-measurement date, and let the data make the case for permanent reallocation.
For brands growing with a constrained budget, the reallocation discipline described here is the highest-leverage move available without adding headcount or capital.
Key Takeaways
Trade spend efficiency is best measured as incremental gross profit per trade dollar, not as total promoted volume or a simple net-sales ratio, because only the incremental measure isolates what the promotion actually generated above baseline.
| Point | Details |
|---|---|
| Core efficiency formula | Incremental Gross Profit ÷ Actual Settled Trade Spend is the primary metric for event-level ROI. |
| Trade rate benchmark | Trade spend typically runs 15–25% of gross sales across CPG, making efficiency a key margin lever. |
| Fix settlement first | Unmatched deductions run 5–10% of gross trade spend; reconciling accruals to actuals recovers margin faster than changing mechanics. |
| Optimize by reallocation | Move 15–25% of budget from bottom-third ROI events to higher-return mechanics; measure after one cycle before making permanent shifts. |
| Cpgagent platform | Cpgagent's AI-driven tools support event record discipline, efficiency measurement, and the quarterly optimization loop for CPG teams. |
The metric most teams are measuring wrong
The conventional wisdom in CPG trade is that a high trade rate signals a problem and a low one signals health. That framing is too simple, and it leads teams to cut spend in the wrong places.
The trade rate (Net Sales ÷ Trade Spend) tells you the gross-to-net relationship, but it says nothing about whether the spend generated incremental volume. A brand with a 17% trade rate and a blended incremental GP per trade dollar of $0.80 is in worse shape than a brand with a 23% trade rate and a $1.40 return. The first brand is spending less and getting less back. The second is spending more and generating real margin.
The deeper problem is that most CPG teams measure efficiency at the total portfolio level, which averages out the distribution of returns and hides the losing tail. A portfolio with 12 events returning 1.6×, 12 returning 1.0×, and 16 returning 0.6× has a blended ROI that looks mediocre. But the 16 low-return events are the actual problem, and they are invisible in a portfolio average. Grade the distribution, not the average. The losing tail is where the margin is hiding.
The other thing teams consistently underestimate is the settlement gap. Fixing accrual-to-actual reconciliation is unglamorous operational work, but it is the fastest path to recovered margin in most CPG organizations. Every dollar of unmatched deductions that goes uncontested is a dollar of gross profit that disappears without a trace. Run the reconciliation before you redesign the promotional calendar.
Cpgagent helps you run the measurement loop faster
Most CPG teams know what good trade spend measurement looks like. The gap is execution: maintaining consistent event records from plan through settlement, running post-event ROI calculations before the next planning cycle starts, and translating efficiency data into reallocation decisions before the window closes.
Cpgagent's AI-powered platform is built for exactly that execution gap. The platform supports event record discipline, incremental GP calculations, and the quarterly optimization loop that turns measurement into margin recovery. Fractional CMO and trade advisory services are available for teams that need senior-level guidance on reallocation strategy and retailer negotiation, without the overhead of a full-time hire. For teams at any stage of trade measurement maturity, Cpgagent provides the infrastructure to move from ad hoc post-mortems to a repeatable, defensible efficiency process.
If your team is ready to run the measurement checklist described in this article and needs a faster path to execution, the platform is the logical next step.
Useful sources and further reading
- NielsenIQ CPG Dictionary: Trade Efficiency — The canonical definition of trade efficiency used across the CPG industry, including the $1 break-even threshold and the promotional lift framework.
- NielsenIQ: 3 Useful Metrics to Optimize CPG Trade Promotion Spend — Practical metric guidance from NielsenIQ covering trade efficiency, promotional lift, and margin impact.
- RGM Academy: Trade Spend Efficiency — Covers the trade load formula, incremental GP per trade dollar, and the distinction between ratio-based and incremental-based measures.
- Scout: What Is Trade Spend? — Definitional overview of trade spend types, the 15–25% benchmark, and P&L placement.
- Scout: Trade Spend Management — Operational guidance on accrual-to-actual reconciliation, deduction matching, and the event record discipline.
- Scout: Trade Spend Optimization — Reallocation framework and the quarterly optimization loop, including the ROI distribution example.
FAQ
What is trade spend efficiency?
Trade spend efficiency measures the incremental gross profit or incremental sales a brand generates per dollar of trade investment. A value above $1.00 means the promotion covered its cost; higher values indicate a stronger return.
What are some examples of trade spend?
Common examples include off-invoice allowances, feature and display fees, slotting fees, scan-down protection, co-op advertising, and billback payments to retailers or distributors.
How does trade spend work on the P&L?
Trade spend appears as a deduction from gross sales in the gross-to-net layer, reducing reported net sales before COGS and gross margin are calculated. It is typically the largest discretionary cost line after COGS for CPG brands.
Where does trade spend sit on a P&L?
Trade spend sits between gross sales and net sales as a deduction. The structure is: Gross Sales → Trade Deductions → Net Sales → COGS → Gross Profit.
How do you measure trade spend efficiency in practice?
Measure promoted velocity against a baseline period, calculate incremental units, convert to incremental gross profit by subtracting COGS, then divide by actual settled trade spend. Cpgagent's platform supports this calculation and event record discipline across the full promotional calendar.