

A winning retailer pitch deck proves three things in the first three to five slides: the product sells at a viable price, the economics hold up at retail margins, and the operation can deliver reliably. Buyers expect specific numbers, not adjectives, on suggested retail price, gross margin, store-week velocity, and reorder rate. Before your next meeting, run those four figures against one real SKU and put the results on slide three or four, where buyers actually look first.
TL;DR:
- Retail buyer decks require precise figures for retail price, gross margin, velocity, and reorder rate, validated with a real SKU before meetings.
- Presenting clear, measurable unit economics and operational milestones is more convincing than vague claims or broad growth projections.
- Traction signals like steady reorder rates, shelf velocity, and customer loyalty metrics hold more weight than just sales volume or door count growth.
- Tailoring the pitch to retailer type involves emphasizing operational readiness and supply chain reliability for big-boxes, or brand story and customer signals for boutiques.
- Avoid cluttered slides and unsubstantiated claims by focusing on one key point per slide, labeling data clearly, and moving detailed info into the appendix.
Table of Contents
- What Slides Belong in a Retailer Pitch Deck?
- What Metrics Do Retail Buyers Actually Check?
- How Do You Present Unit Economics Retailers Will Believe?
- What Traction Actually Convinces a Buyer?
- What Should a Retail Launch Plan Actually Commit To?
- What Design Choices Make Buyers Trust Your Numbers?
- What Do Buyers Check Before Approving a Purchase Order?
- How Should You Present Your Team to Build Buyer Trust?
- What Does a Strong Ask Actually Look Like?
- What Traction Milestones Actually Move Buyers and Investors?
- What Mistakes Cause Buyers to Stop Reading a Deck?
- How Do You Adjust the Pitch for Different Retailer Types?
- Author Perspective: One Note on Pitching Retailers
- Turn Your Retail Facts Into a Ready-to-Present Deck
- Sources
- FAQ
What Slides Belong in a Retailer Pitch Deck?
Retail buyers and investors read decks differently, but the core sequence rarely changes. A consumer retail pitch deck template built around four proof points, shopper problem, viable economics, distribution capability, and a measurable ask, tends to outperform generic startup templates because it front-loads what buyers actually check first.
Here's a slide order that works for most CPG pitches, whether you're across a table from a category buyer or an angel investor.
- Cover and one-line positioning. What the product is and who buys it, in one sentence.
- Shopper problem. The specific unmet need, backed by a customer quote or search data if you have it.
- Product and price. SRP, pack size, and how it fits the category shelf set.
- Unit economics. Landed cost, gross margin, and contribution margin for one SKU.
- Traction. Sales to date, doors, pilot results, reorder rate.
- Retailer metrics. Store-week velocity, sell-through, fill rate.
- Go-to-market plan. Initial doors, merchandising, promotional support.
- Operational readiness. Lead times, case pack, fulfillment capability.
- Team. Founders and advisors with retail-relevant experience.
- Competition and differentiation. Where you sit versus the next three SKUs on the shelf.
- The ask. Distribution commitment or funding amount, tied to a 12-month milestone.
- Appendix. Detailed financials, supplier contracts, additional store data.
NielsenIQ's guidance on CPG pitch decks makes a distinction worth internalizing: buyer decks should swap funding language for operational commitments, assortment plans, case pack details, warehouse destinations, lead times, launch support, while investor decks keep the ask framed around capital and equity. Same core slides, different slide 11.
Move anything that isn't decision-critical into the appendix. If a buyer wants to dig into your supplier contract or three years of granular P&L, they'll ask. Don't make them wade through it to reach your ask.
What Metrics Do Retail Buyers Actually Check?
Buyers have seen hundreds of decks with vague margin claims. The ones that get callbacks show real formulas with real numbers attached.
Here's what to define and calculate before you build a single slide:
- Suggested retail price (SRP): the shelf price the retailer will charge shoppers.
- Landed cost: your total cost per unit including manufacturing, freight, duties, and packaging, delivered to the retailer's dock.
- Gross margin: (SRP minus wholesale price) divided by SRP, expressed as a percentage the retailer earns.
- Contribution margin: your wholesale price minus landed cost minus variable selling costs, which tells you what you actually keep per unit sold.
- Store-week velocity: units sold per store per week, the number that determines whether a retailer keeps you on shelf or resets you out.
- Sell-through rate: units sold divided by units received, tracked over a defined window.
- Reorder rate: the percentage of initial door placements that generate a second purchase order.
- Fill rate: the percentage of ordered units you actually ship on time and complete.
Retailer buyers expect these figures with clear denominators and specific measurement windows, not "roughly 40% margin" with no context. Always label the store cohort, the number of weeks measured, and the SKU.
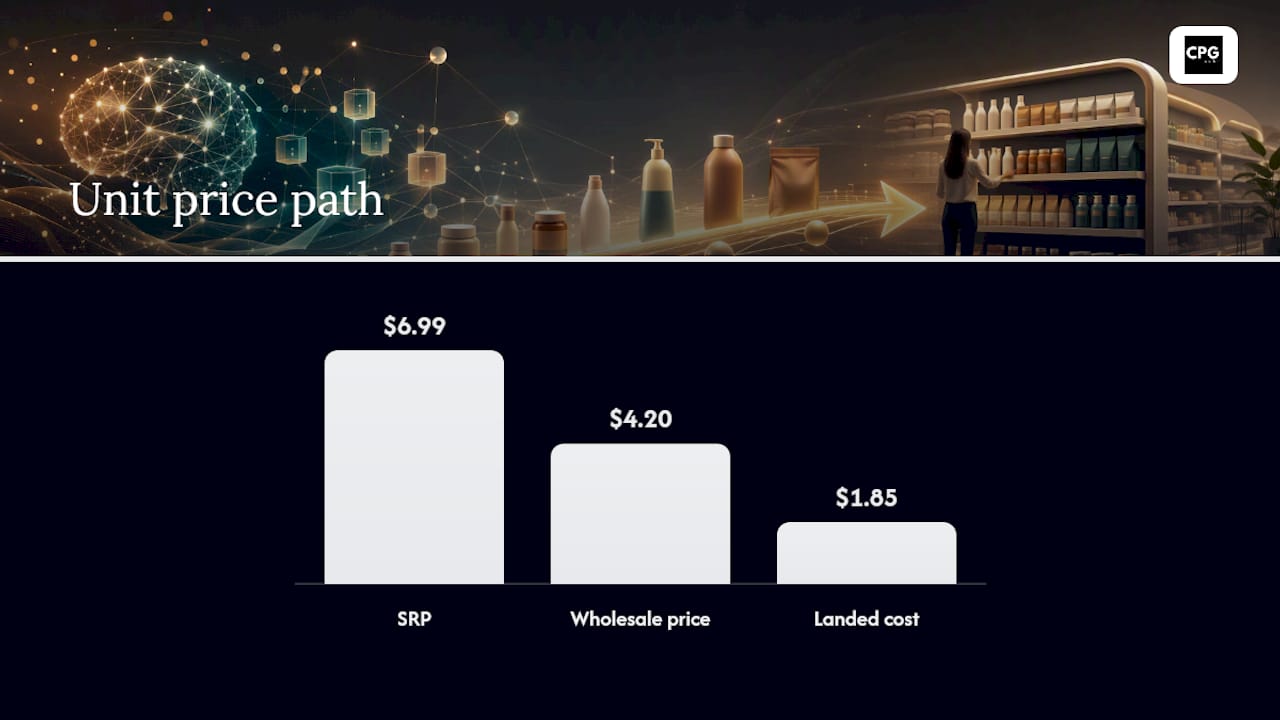
A worked example: say your SRP is $6.99. Wholesale price to the retailer is $4.20 (a 40% retailer margin). Your landed cost per unit is $1.85. Tracing that path from SRP to contribution margin with real numbers on one-slide resolves more buyer skepticism than three slides of abstract percentage claims.
How Do You Present Unit Economics Retailers Will Believe?
The mistake most founders make is presenting economics as static percentages instead of showing how they scale with distribution. Buyers want to see the model flex.
- Convert your per-order contribution margin into a per-store-per-week projection: multiply expected velocity by contribution margin per unit, then by the number of stores in your pilot or launch cohort.
- Present CAC and CAC payback only if you have DTC or retail media data to back it. A CAC payback stated in months, tied to actual ad spend and actual repeat purchase data, carries far more weight than a modeled estimate.
- Tie three-year projections to concrete distribution milestones, not growth curves. "We reach 500 doors by month 18 based on a signed regional distribution agreement" beats "we project 30% month-over-month growth" every time.
- Show your model at three velocity scenarios, conservative, expected, and strong, so buyers see you've stress-tested the numbers rather than picked the one that looks best.
Investors reading a CPG deck tend to anchor on CAC payback as a proxy for capital efficiency. The Retail Zipline Series A deck that closed with Emergence Capital leaned on this exact framing, using CAC payback alongside customer-love metrics to show the business scaled efficiently, not just quickly.
Read more on margin readiness for major retail if you want to stress-test your model before the meeting.
What Traction Actually Convinces a Buyer?
Not all traction reads the same way to a retail buyer. DTC sales tell you people will buy online. Wholesale traction tells you the product survives real shelf conditions, competing planograms, price sensitivity, and reorder cycles under retailer terms. Pilot data sits in between: it's the clearest signal of how a real retailer relationship performs before you scale it.
Format sell-through and reorder charts so a skeptical buyer can verify them at a glance. Every chart needs the retailer name, the store cohort, the number of weeks measured, and the SKU-level denominator or buyers will discard the number outright, no matter how good it looks.
| Traction type | What it proves | Best format to show |
|---|---|---|
| Pilot results | Product performs under real retail conditions | Sell-through % with retailer, cohort, and week count labeled |
| DTC sales | Demand exists and messaging resonates | Repeat purchase rate and average order value trend |
| Wholesale reorder | Retailer wants to keep buying | Reorder rate by door cohort over a defined quarter |
| Customer love signals | Product creates loyalty, not just trial | NPS score, pilot-to-contract conversion rate |
Customer-love signals matter more to investors than most founders realize. NPS scores, pilot-to-contract conversion, and low churn all functioned as capital-efficiency signals in the Zipline deck, because they suggest the product sells itself once it's in front of the right buyer.
What Should a Retail Launch Plan Actually Commit To?
Buyers don't fund vision statements. They fund specific operational plans with named owners.
- State your initial assortment precisely. List the SKUs, case pack size, and the specific launch geography or region, not "nationwide rollout."
- Lay out your promotional plan and who pays. In-store demos, retail media spend, and sampling programs should each have a stated budget and a stated funding source, whether that's you, the retailer, or a co-op arrangement.
- Build a launch timeline with named owners. Assign field sales, marketing, and operations to specific weeks so the buyer sees execution capacity, not just intent.
Retailers have seen brands promise national marketing support and deliver nothing. Naming your promotional spend and who's funding it, even if it's modest, builds more trust than a vague "robust marketing campaign" slide. If slotting costs or launch fees are part of the conversation, understanding how slotting fees typically work before the meeting keeps you from getting caught flat-footed on price.
What Design Choices Make Buyers Trust Your Numbers?
Buyers skim. A deck with one claim per slide moves faster through a buying committee than one that crams five data points onto a single page.
- Keep each slide to a single main claim, backed by one chart or one number, not a wall of bullet points.
- Use shelf mockups and product photography sparingly, enough to show fit on the shelf, not so much that it buries your metrics.
- Label every chart axis and denominator directly on the slide so a buyer skimming in a hallway still understands it.
- Move detailed supplier contracts, extended financials, and raw survey data to the appendix, not the main deck.
Pro Tip: Print your deck and hand it to someone outside your industry. If they can't tell your gross margin and your ask within 90 seconds of flipping through it, your slides are doing too much talking and not enough showing.
What Do Buyers Check Before Approving a Purchase Order?
Retail buyers have been burned by brands that pitched well and then couldn't deliver. Before you're in the room, have these ready:
- Case pack configuration and UPC or barcode registration confirmed and functional.
- Lead time from purchase order to delivery, stated in days, not "as soon as possible."
- A fill rate target you can actually hit, ideally above 95%, with a plan for what happens if you miss it.
- Packaging specs, palletization standards, and any point-of-sale materials ready to ship with the first order.
- A stated returns policy and a plan for exception handling, plus contingency stock to cover unexpected velocity spikes.
Buyers ask about backup suppliers and contingency stock because stockouts cost them shelf credibility with their own management. Having an answer ready, even a simple one, signals operational maturity that a slide alone can't fake.
How Should You Present Your Team to Build Buyer Trust?
Retail buyers trust teams with direct category or retail-side experience more than teams with only DTC or agency backgrounds. If a founder or advisor previously worked buying-side at a retailer, managed a category P&L, or ran operations for a brand that scaled through similar channels, say so explicitly.
- List prior roles that map directly to retail execution: category management, supply chain, retail buying, not just "marketing executive."
- Show advisor and partner logos only where the relationship is real and active, and keep claims about their involvement specific rather than implying a partnership that doesn't exist.
- Write one-line bios that state the relevant credential first: "Former Target category buyer" reads faster and lands harder than a full paragraph of career history.
What Does a Strong Ask Actually Look Like?
The ask is where most decks go soft. Vague asks get vague responses.
- For a distribution ask: name the exact number of initial doors, the replenishment cadence you're requesting, and any merchandising support (endcap, secondary placement) you're asking the retailer to provide.
- For a funding ask: state the amount, the specific use of funds (inventory, retail media, headcount), and the milestone you'll hit in 12 months, additional doors, a target reorder rate, or a specific revenue figure.
- Address risk directly, briefly. One slide, or one line, naming your biggest operational risk and your mitigation plan reads as confidence, not weakness.
Public pitch decks that raised real capital, like the one behind Kevel's $23 million raise, tend to close with exactly this structure: a specific number, a specific use, and a specific next milestone, not an open-ended "join us" slide.
What Traction Milestones Actually Move Buyers and Investors?
Traction reads differently depending on who's across the table, but both buyers and investors are looking for evidence that demand is durable, not just present. Raw sales figures matter less than the trend line behind them. A buyer wants to see that stores you're already in are reordering, not just that you shipped once and moved on.
Door count matters, but growth in door count matters more. Going from 12 doors to 40 doors over two quarters, with sell-through holding steady or improving, tells a stronger story than launching in 200 doors with declining velocity. Retailers know that overexpansion without operational readiness leads to resets, and they'll ask about your velocity trend before they ask about your total door count.
Pilot outcomes carry outsized weight because they're the cleanest signal available before a full rollout.
Repeat rate, whether measured as reorder rate at retail or repeat purchase rate direct-to-consumer, is the metric that separates novelty products from ones with staying power. Buyers have all seen a hot product sell through once and then die on shelf. A repeat rate that holds steady across two or three ordering cycles is the strongest traction signal available in a deck.
What Mistakes Cause Buyers to Stop Reading a Deck?
The most common failure isn't a weak product. It's a deck that hides weak thinking behind good design.
Vague margin claims top the list. "Strong margins" or "healthy unit economics" with no actual number attached reads as either inexperience or evasion, and buyers assume the worst. Every margin claim needs a number and a formula behind it.
Overstated distribution ambitions come next. Claiming a launch in 500 doors within six months, with no signed agreements or pilot data to support it, damages credibility faster than a modest, achievable plan. Buyers have heard the big promise before, and they've watched it fail before.
Missing operational detail is a quieter killer. A deck can nail the story and the numbers, and still get shelved if it never addresses lead time, fill rate, or case pack logistics. Buyers read that omission as a sign the team hasn't thought past the pitch.
Cluttered slides with multiple competing claims slow decision-making. If a buyer has to hunt for the number that matters, they'll move to the next deck in the stack instead.
Finally, skipping the appendix and cramming supporting data into the main deck buries the argument. Keep the narrative tight, and let the appendix carry the depth.
How Do You Adjust the Pitch for Different Retailer Types?
A big-box retailer and a boutique specialty store are evaluating completely different risk profiles, and your deck should reflect that.
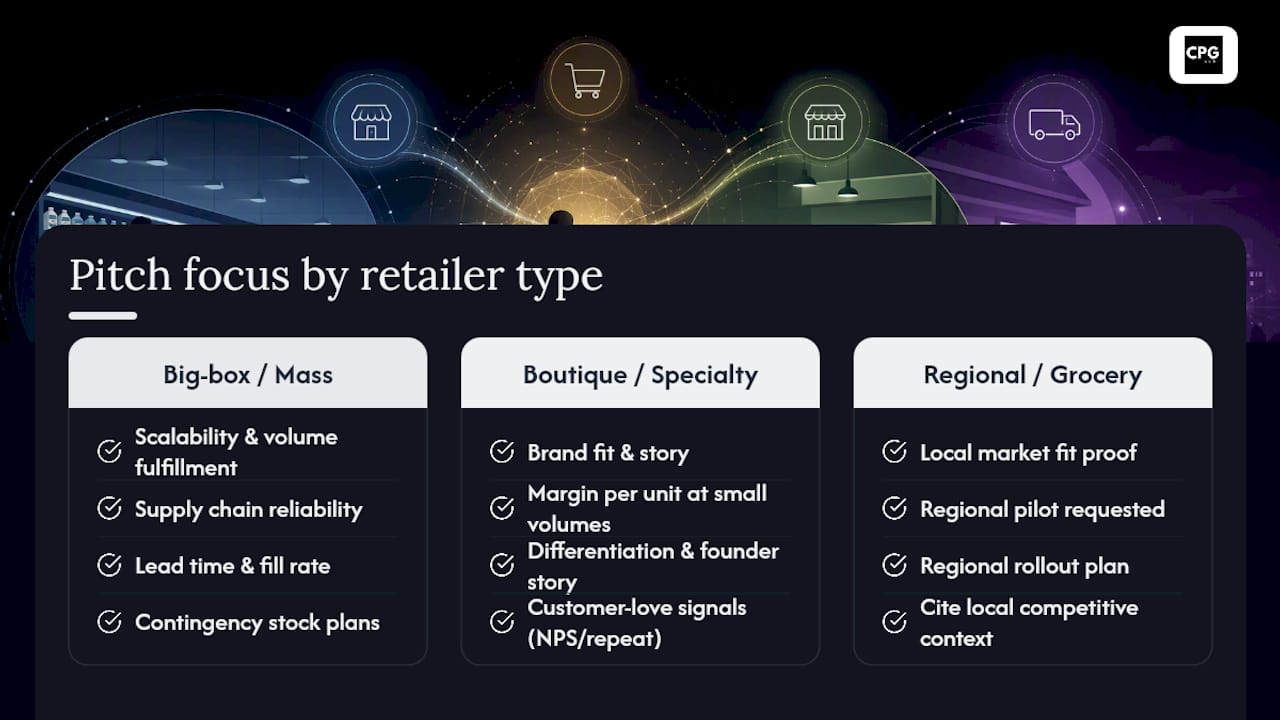
Big-box and mass retailers care most about scalability, supply chain reliability, and category-level performance data. They want to see that you can fulfill large purchase orders consistently, that your fill rate holds up under volume, and that your product fits into a broader category strategy they're already executing. Lean harder on operational readiness slides, lead time, fill rate, contingency stock, and show category-level sales data if you have any comparable benchmarks.
Boutique and specialty retailers care more about brand fit, story, and margin per unit than sheer volume. They're often more willing to take a chance on a newer brand if the story resonates with their customer base and the margin works at smaller order volumes. Lean into differentiation, founder story, and customer-love signals like NPS or repeat purchase behavior, since these buyers often make decisions faster and with more discretion than a big-box category team.
Regional and grocery chains sit in between: they want proof of local market fit and often ask for a regional pilot before committing chain-wide. Tailor your go-to-market slide to show a regional rollout plan rather than a national one, and cite local competitive context if you have it.
The core slides stay the same across all three. What changes is which slide gets the most airtime and which metrics you lead with.
Author Perspective: One Note on Pitching Retailers
Most founders spend their prep time polishing the story slide and rush the metrics. That's backwards. Buyers have heard a hundred good stories; what stops them is a margin number that doesn't hold up under a follow-up question. Before your next meeting: recalculate your contribution margin at your actual current landed cost, not last quarter's, confirm your fill rate target is realistic for your current supplier relationship, and cut any slide that doesn't directly support your ask. Tools like Cpgagent's platform can help teams pressure-test these numbers before they reach a buyer's desk, but the discipline of checking your own math first is what actually earns the second meeting.
— Matthew
Turn Your Retail Facts Into a Ready-to-Present Deck
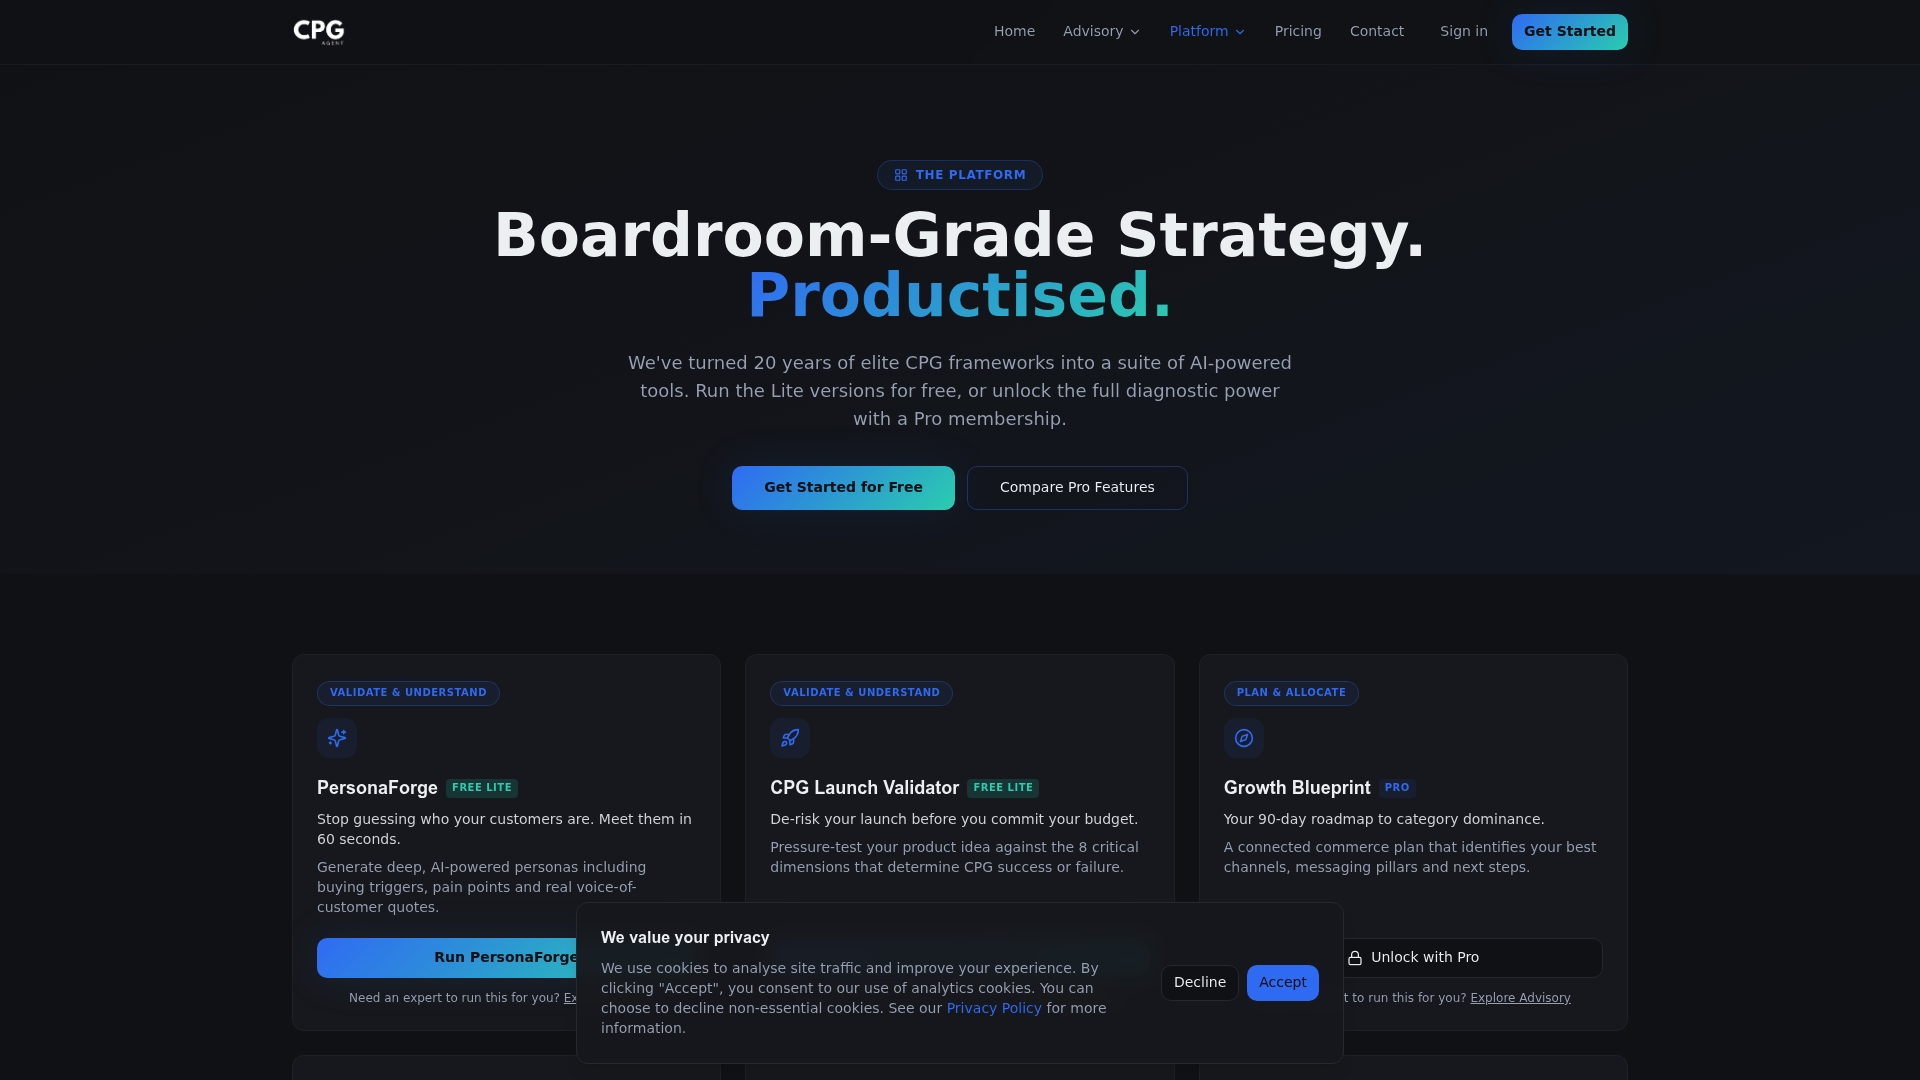
This platform gives CPG teams a faster path from raw retail data to a deck that survives buyer scrutiny, without hiring a full agency team to build it. Tools take your pricing, margin, and velocity inputs and turn them into slide-ready claims, the same numbers a buyer will ask about, formatted as recommended by NielsenIQ's guidance.
If you need more than the tools, Cpgagent's fractional CMO advisory helps package the ask itself, whether that's a distribution request or a funding round, and align it with realistic 12-month milestones. This matters most when you're negotiating merchandising support or launch terms and need someone who has done it before to sanity-check your numbers. Start by exploring the platform to see how the AI-driven workflow converts your existing retail data into presentation-ready slides before your next buyer meeting.
Sources
- Consumer retail pitch deck template | AnyGen
- How Retail Zipline’s Series A pitch deck ticked every box for Emergence Capital | TechCrunch
- Pitch Deck: Kevel raises $23 million to boost retail advertising | Business Insider
FAQ
What Is the 10/20/30 Rule for a Pitch Deck?
The rule suggests 10 slides and no font smaller than 30 points, though most retail-focused decks stretch to 10 to 12 slides to accommodate retailer-specific metrics like landed cost and store-week velocity.
What Is a Sales Pitch Deck?
A sales pitch deck is a slide presentation built to persuade a specific buyer, retailer, distributor, or investor, to take a defined action, whether that's granting shelf space, signing a purchase order, or committing capital.
How Much Should a Pitch Deck Cost?
Costs vary widely depending on whether you build it yourself, hire a freelance designer, or use an AI-assisted platform; the real cost driver is usually the time spent gathering accurate metrics, not the design work itself.
What Is a Business Pitch Deck?
A business pitch deck is a broader term covering any slide presentation used to explain a company's model, traction, and ask an external audience, and a retailer pitch deck is a specialized version focused on shelf economics and operational readiness.
How Long Should a Retailer Pitch Deck Be?
Ten to 12 slides works best for most initial retailer conversations, with supporting data, contracts, and extended financials moved into an appendix rather than the main deck.