

Price elasticity testing measures how much demand moves when you change a price, expressed as percent change in quantity divided by percent change in price. The number you get tells you, before you commit, whether raising or lowering a price will grow profit or shrink it. Run it segment by segment, use behavioral data when volume allows, and treat the result as a direction, not a guess.
TL;DR:
- Demand elasticity varies significantly across segments, with some cohorts tolerating large price increases while others react strongly to small changes.
- Survey-based methods are useful for early hypotheses but tend to overstate actual buying behavior, requiring a 10-20% discount adjustment.
- Behavioral experiments with at least 1,000 observations per variant provide the most reliable, transaction-based demand insights.
- Proper test design involves selecting stable products, fixing baseline metrics, implementing small price changes, and isolating variables during a 7-14 day period.
- Segment-specific elasticity results guide pricing adjustments more effectively than a single blended number, especially when demand responses differ widely.
Table of Contents
- What Is Price Elasticity of Demand, and How Do You Calculate It?
- Why Run Price Elasticity Tests in the First Place?
- Which Measurement Method Should You Use?
- How Do You Design and Run a Price Elasticity Test?
- How Do You Interpret Elasticity Results and Turn Them Into Pricing Decisions?
- What Mistakes Should You Avoid When Testing Price Elasticity?
- How Does Cpgagent Operationalize Price Elasticity Testing?
- When Should You Trust a Survey Over a Behavioral Test?
- Run Price Elasticity Testing Without Building a Data Team From Scratch
- Sources
- FAQ
What Is Price Elasticity of Demand, and How Do You Calculate It?
Price elasticity of demand is the ratio of percentage change in quantity demanded to percentage change in price. The formula looks simple: %ΔQ ÷ %ΔP. The sign matters as much as the number. Demand almost always moves opposite to price, so most elasticity values come out negative, and marketers usually discuss the absolute value when comparing products.
Here's a worked example. Say you raise a product's price by 10% and unit sales drop 5%. That's an elasticity of -0.5, meaning demand is inelastic: a 1% price increase costs you roughly half a percent in volume, which usually means more revenue, not less.
Elasticity is not the same thing as price sensitivity in the loose sense marketers often use. Price sensitivity is a qualitative sense that customers care about price. Elasticity of demand testing puts a number on exactly how much they care, which is what lets you model outcomes instead of debating opinions.
- Elastic demand: absolute value greater than 1. Small price moves cause big volume swings.
- Inelastic demand: absolute value less than 1. Volume barely reacts to price.
- Unit elastic: exactly 1. Revenue stays flat regardless of price direction.
Quick stat: an elasticity of -0.5, as in the example above, means a 1% price hike only costs you a 0.5% drop in units, which is the kind of gap that turns a price increase into a profit increase.
Why Run Price Elasticity Tests in the First Place?
Elasticity testing exists to answer one question every pricing team eventually faces: will this price change grow revenue, or just shift volume around? Without a tested number, that question gets answered by gut feel, competitor mimicry, or finance spreadsheets built on assumptions nobody checked.
A tested elasticity value changes real decisions. It tells you whether a new SKU launch should be priced at a premium or near parity, whether a tiered subscription plan needs three price points or five, how deep a promotional discount actually needs to go to move volume, and what argument you bring into a retailer negotiation over margin.
- Predicts the revenue-versus-volume trade-off before you touch a live price
- Prevents blanket price changes that ignore how different customer segments actually behave
- Turns retailer and channel pricing conversations into math instead of negotiation by instinct
- Surfaces confidence intervals that tell you when a result is solid versus when it's noise
Segment-level results matter more than the topline number. Segment elasticities often vary two to four times between cohorts, so a single blended figure can mask a cohort that would tolerate a big increase and another that would bolt at half that size.
Which Measurement Method Should You Use?
No single method wins every situation. The right choice depends on whether you have a live product with transaction data, a concept that hasn't launched yet, or a multi-attribute bundle where price is just one variable among several.
Van Westendorp Price Sensitivity Meter works best for new products with no price history. It asks customers at what price the product feels too cheap, too expensive, a bargain, or too pricey, and maps an acceptable price range from the answers. It needs roughly 150 to 200 respondents per segment to produce a stable curve.
Gabor-Granger tests a series of specific price points against purchase intent to find the single price that maximizes revenue for one product. It uses a similar sample size, 150 to 200 per segment, but delivers a sharper, single-number recommendation rather than a range.
Conjoint analysis (CBC) fits best when price is bundled with other attributes, like package size, subscription tier, or feature sets. It reveals what customers actually trade off, but it's the most resource-intensive of the survey methods and needs more data collection and modeling effort to run well.
Behavioral experiments (A/B tests or geo-splits) are the gold standard when you have enough transaction volume, because they measure what people actually buy rather than what they say they'd buy. Ecommerce A/B price tests often need 1,000 or more observations per variant to reach solid statistical confidence.
Historical econometric analysis works when your pricing history already contains enough natural variation to model. The catch is endogeneity: prices often rise precisely when demand is already strong, which can bias a naive model unless you correct for it with instruments or a natural experiment.
Pro Tip: Survey-based methods tend to overstate real buying intent. Apply a revealed-preference discount of roughly 10 to 20 percent to stated purchase intent before you use it to project actual revenue.
How Do You Design and Run a Price Elasticity Test?
A good test follows a fixed sequence. Skip a step and you end up with a number you can't trust.
- Pick test candidates with stable baselines. Choose products or segments with steady traffic and no major seasonal swing coming up. A SKU that's about to hit its holiday peak will give you a distorted read.
- Capture baseline metrics first. Record current conversion rate, unit margin, and average order value before you touch anything. You need a clean "before" to measure the "after" against.
- Calculate your floor. Know your break-even price before you start. Cpgagent's platform can model margin impact across price scenarios quickly, which saves you from testing a price you could never actually ship.
- Size the price differential. Change price by 10 to 20 percent between test conditions. Smaller moves often get lost in normal day-to-day noise and won't produce a readable signal.
- Randomize and isolate. Split test cohorts by A/B assignment, geography, or time window, and change nothing else during the test. No promo overlays, no creative refreshes, no site redesign mid-test.
- Run for 7 to 14 days. That window is long enough to smooth out day-of-week noise but short enough to avoid seasonal contamination.
- Collect and calculate. Use arc elasticity (which averages the base and end values) rather than point elasticity when the price change is large, since arc elasticity gives a more stable result across a wider price swing. Break the results out by segment, not just in aggregate.
Quick stat: live ecommerce price experiments typically need 1,000-plus observations per variant before you can trust the result at a meaningful confidence level.
How Do You Interpret Elasticity Results and Turn Them Into Pricing Decisions?
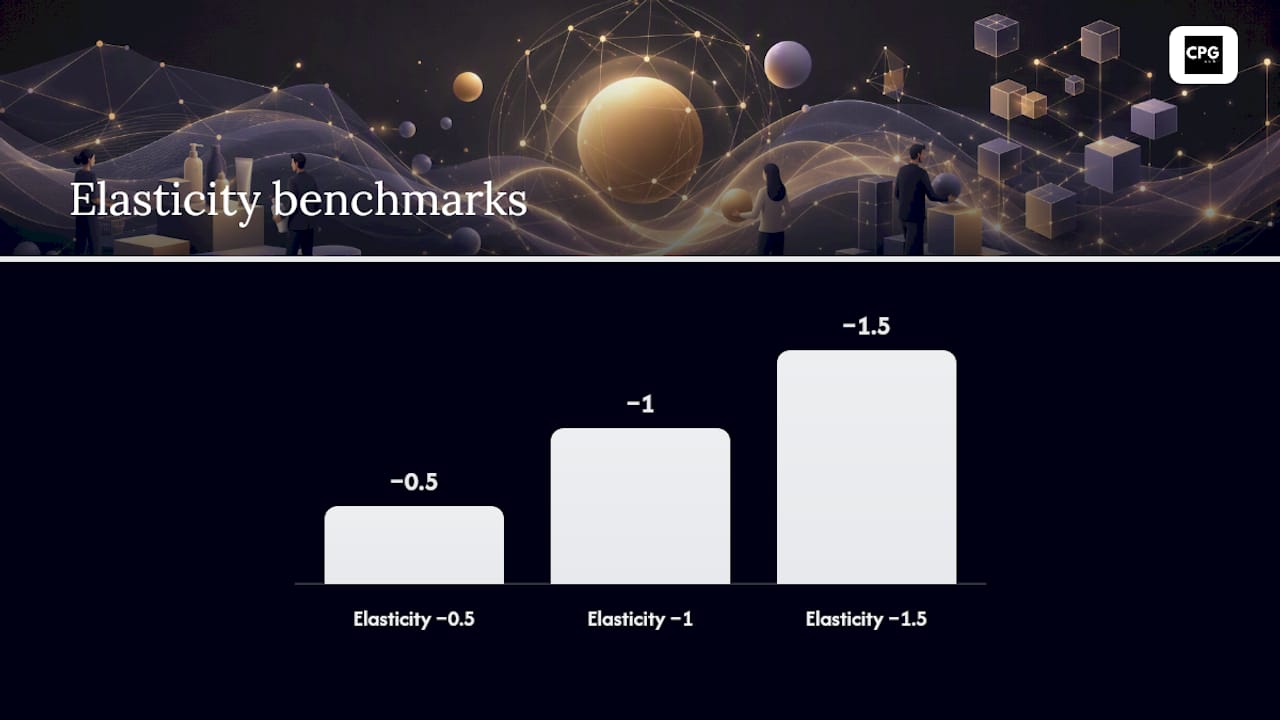
An elasticity of -0.5 tells you a price increase will likely grow revenue, because volume falls slower than price rises. An elasticity of -1.5 tells you the opposite: raise price and you'll lose more in volume than you gain in unit margin, so revenue drops. The general rule holds across most categories: revenue is maximized right around an elasticity of -1, the point where a price move and its volume response cancel out.
Margin changes this math. A product with fat gross margin can absorb more volume loss from a price increase and still come out ahead, so the safe zone for raising prices widens as margin grows. Run the break-even calculation before you commit, using the same logic covered in unit economics for CPG brands, so you know the exact volume drop you can tolerate.
Segment differently. Lift prices where a cohort tests inelastic, and hold or protect price where a cohort is elastic or shows high churn risk. Blending those two groups into one decision is how good tests produce bad outcomes.
- Treat -1 as your rough revenue-maximizing benchmark, not a hard rule
- Recalculate break-even using actual gross margin, not a rounded estimate
- Rerun tests when a market shift (new competitor, macro pullback) makes an old result stale
- Triangulate survey signals against a small behavioral pilot before a full rollout
Pro Tip: For subscription or repeat-purchase businesses, check churn impact alongside conversion. A short-term conversion win can hide a longer-term revenue loss if the price change pushes existing customers to cancel.
What Mistakes Should You Avoid When Testing Price Elasticity?
Most bad elasticity data doesn't come from a wrong formula. It comes from a test design that let some other variable contaminate the result.
- Don't expose visibly different prices to customers who can directly compare them, which risks brand backlash and fairness complaints, not just a data problem.
- Isolate the price change completely. If marketing spend, page design, or a promo runs at the same time, you can't tell which variable caused the shift.
- Avoid testing across seasonal peaks or a competitor's sale window, since either one will swamp your signal with noise that has nothing to do with price.
- Report results by segment with confidence intervals attached, not as one blended number that hides how different cohorts actually behaved.
- Discount survey-based purchase intent before you use it to forecast revenue. Stated intent runs optimistic compared to actual behavior.
Own-price elasticity, the type covered throughout this article, is only one piece of the picture. Cross-price elasticity measures how a competitor's or complement's price shift affects your demand, and income elasticity measures how demand shifts as buyer income changes. All three respond to conditions you don't control, like market trends, competitor pricing moves, and macroeconomic pressure on discretionary spending, so a result from six months ago deserves a second look before you lean on it today.
How Does Cpgagent Operationalize Price Elasticity Testing?
Some pricing solutions build elasticity testing into a repeatable workflow instead of a one-off spreadsheet exercise. The typical path starts with a survey-based price range, moves to a small behavioral pilot to confirm real buying response, and finishes with a segmented rollout backed by a revenue model.
- Automated scenario modeling checks margin impact across multiple price points before a single test goes live
- Unit-economics checks catch a price floor problem before it becomes a live pricing mistake
- Retail-readiness checks, covered in margin planning for major retail, tie elasticity results to wholesale and shelf-price decisions
When Should You Trust a Survey Over a Behavioral Test?
Surveys are fine for early-stage hypotheses: a new SKU with no sales history, or a category where transaction volume is too thin for a clean A/B split. Once real money and real customers are on the line, demand behavioral evidence. The rule I use: surveys tell you where to look, behavioral tests tell you where to price.
— Matthew
Run Price Elasticity Testing Without Building a Data Team From Scratch
Most CPG teams don't lack the will to test pricing properly. They lack the modeling tools and the bandwidth to run a segmented test, check break-even, and build a revenue model before a price ever goes live. Some platforms close that gap: instead of hiring an analyst or waiting on an agency's discovery phase, you get scenario modeling and experiment tracking built specifically for CPG pricing decisions.
The Cpgagent platform lets you model margin impact across price points, design a segmented test, and connect the result straight to a revenue forecast, all without adding headcount. If your team is also weighing a broader pricing or growth push, pair elasticity testing with the growth hacking tactics built for FMCG brands to see how test-driven pricing fits into a wider growth plan. Start by requesting a platform walkthrough and bring your next price change into the test before it goes live on the shelf.
Sources
- How to calculate price elasticity of demand (MasterClass)
- Price elasticity testing guide (Shopify blog)
- Price sensitivity analysis (SurveyMonkey Learn)
- Food demand analysis and elasticity concepts (USDA ERS)
FAQ
How Do You Measure Price Elasticity?
Divide the percentage change in quantity demanded by the percentage change in price, using either a survey method like Van Westendorp or Gabor-Granger, or a behavioral test like an A/B price experiment for a causal, transaction-based result.
What Does a Price Elasticity of 0.5 Mean?
An elasticity of -0.5 means demand is inelastic: a 1% price increase only reduces quantity demanded by about 0.5%, which usually points toward a price increase raising total revenue.
What Are the Main Types of Price Elasticity of Demand?
The core types are own-price elasticity (how demand for a product responds to its own price), cross-price elasticity (how demand shifts with a competitor's or complement's price), and income elasticity (how demand shifts as buyer income changes); economists also describe elastic, inelastic, and unit-elastic demand as elasticity categories rather than separate types.
What Does It Mean if Elasticity Is Greater Than 1?
An absolute elasticity value greater than 1 means demand is elastic: quantity demanded changes by a larger percentage than the price did, so a price increase in that range typically reduces total revenue rather than growing it.
How Long Should a Price Elasticity Test Run?
Most ecommerce price elasticity experiments should run for seven to 14 days, long enough to smooth out day-of-week variation without drifting into a different season or promotional cycle.