

TL;DR:
- Unit economics evaluates profit and cost per customer or order, guiding sustainable growth. Founders should track key metrics like contribution margin, true CAC, and LTV within 12 months for accurate insights. Regular, detailed reporting helps brands prevent margin erosion and make better scaling decisions.
Unit economics is defined as the measurement of profit and cost on a per-unit basis, revealing whether each customer, order, or subscription contributes positively to your startup's financial health. The role of unit economics in startup brands goes far beyond accounting. It determines whether growth creates value or destroys it. Founders who understand contribution margin, Customer Acquisition Cost (CAC), and Customer Lifetime Value (LTV) make better decisions about pricing, marketing spend, and when to scale. This guide breaks down the core metrics, 2026 benchmarks, and the most common mistakes that distort the picture.
What are the key components of unit economics for startup brands?
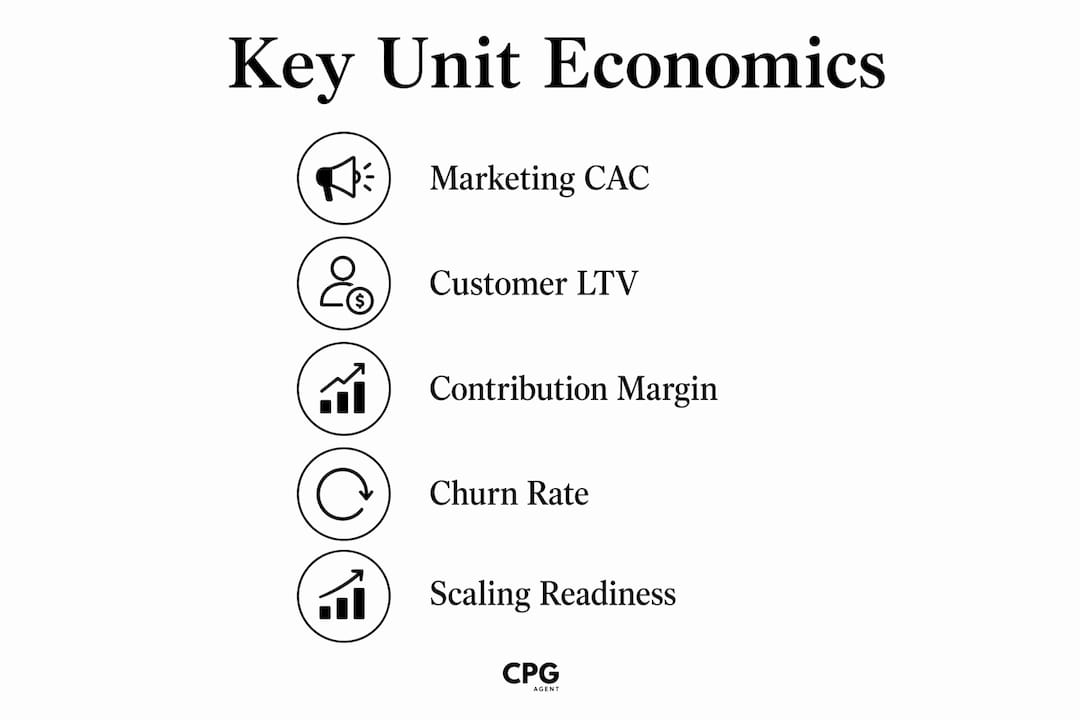
Unit economics centers on a handful of metrics that, together, tell you whether your business model actually works at the customer level.
The core metrics every founder must track:
- Average Order Value (AOV): The revenue generated per transaction. AOV is your starting point for every profitability calculation.
- Cost of Goods Sold (COGS): The direct cost to produce or source the product. This is the first deduction from AOV.
- Contribution Margin (CM): The revenue left after subtracting all variable costs. Founders typically track three levels: CM1 (after COGS), CM2 (after fulfillment and shipping), and CM3 (after marketing spend). Each level reveals a different layer of profitability.
- Customer Acquisition Cost (CAC): The total cost to acquire one new customer. True CAC includes paid ads, agency fees, creative production, and influencer costs. Platform dashboards alone underestimate true CAC by 30–60%, which means founders relying only on ad platform data are flying blind.
- Customer Lifetime Value (LTV): The total revenue a customer generates over their relationship with your brand. The most defensible version uses a 12-month bounded LTV based on observed repeat purchase behavior, not optimistic projections.
- Payback Period: The number of months it takes to recover your CAC from a customer's contribution margin. Payback periods below 12 months are preferred for brands growing on debt financing. Longer paybacks require patient equity capital.
Pro Tip: Never calculate CAC from your ad platform dashboard alone. Pull your total marketing spend for the period, including agency retainers and creative fees, then divide by new customers acquired. That number is your real CAC.
A healthy LTV to CAC ratio sits at a minimum of 3:1. A ratio of 5:1 or higher signals readiness to scale confidently, and above 10:1 indicates strong valuation potential for investor conversations.

How do startup brands use unit economics to scale sustainably?
Sustainable scaling starts with a clear decision rule. If your contribution margin to CAC ratio falls below 0.7, increasing your marketing budget accelerates losses. Above 1.0, you have confidence to scale. That single ratio cuts through a lot of noise in growth planning.
Here are the four strategies founders use to improve unit economics before scaling:
- Raise AOV through bundling and upsells. Higher AOV spreads fixed fulfillment costs across more revenue per order. A brand selling a $30 single product that bundles to $75 dramatically improves CM2 without changing COGS.
- Reduce variable costs systematically. Fulfillment, returns processing, and payment fees erode margins before marketing spend is even counted. A multi-node fulfillment strategy reduces last-mile shipping costs by 15–25% and pays back within 12–18 months for mid-size brands.
- Track CAC by channel and acquisition cohort. Blended CAC hides which channels are profitable and which are destroying value. Brands scaling from $5M to $50M often lack a weekly view of unit economics by channel and cohort, which erodes underlying business value even as topline revenue grows.
- Improve retention to extend LTV. A customer who buys three times in 12 months is worth far more than your CAC suggests at first purchase. Repeat purchase rate and cohort analysis are the most reliable tools for forecasting LTV realistically.
Pro Tip: Run a payment fee audit quarterly. Switching processors or negotiating rates on high-volume SKUs can recover 0.5–1.5 percentage points of contribution margin with zero impact on the customer experience.
The growth-at-all-costs model is obsolete. The new standard is first-order profitability: a positive contribution margin on the very first sale. Brands that cannot achieve this are structurally dependent on repeat purchases to break even, which is a fragile position in a competitive market. Brands with strong pricing power can also use transparent, narrative-led price increases to restore margins. Brands with good brand equity that raise prices by 12–18% sustain customer loyalty while significantly improving unit economics.
For founders looking to grow without burning cash, the CPG brand budget guide covers margin-first growth strategies in detail.
What mistakes do startup founders make with unit economics?
Most unit economics errors are not calculation errors. They are framing errors. Founders measure the wrong things, or measure the right things incorrectly.
- Underestimating true CAC. Excluding agency fees, creative production, and influencer costs from CAC calculations results in a 30–60% undercount of actual acquisition cost. This makes the business look more efficient than it is.
- Misclassifying shipping subsidies. Moving shipping subsidies from the contribution margin line to the marketing budget restates profitability downward by 8–12 percentage points. Founders who make this error consistently overstate CM2 and understate the true cost of customer acquisition.
- Using overly optimistic LTV projections. Extrapolating LTV beyond 12 months without observed repeat purchase data inflates the metric and justifies CAC levels the business cannot sustain. The 12-month bounded LTV is the defensible standard.
- Relying on blended CAC. A blended CAC across all channels masks the fact that some channels are profitable and others are not. Channel-specific CAC is the only version that supports real budget allocation decisions.
- Ignoring returns processing costs. Returns cost money to process, restock, or write off. Excluding this from variable cost calculations overstates CM2 and CM3 for any brand with a meaningful return rate.
- Following outdated benchmarks. Unit economics benchmarks shifted materially after 2022. Founders using pre-2023 LTV:CAC or payback period targets are calibrating against a market that no longer exists.
If you are preparing for retail expansion, check whether your margins are retail-ready before committing to shelf space that requires deeper discounting.
How do you track and report unit economics effectively?
Visibility is the difference between reacting to problems and preventing them. A weekly dashboard, updated daily, gives founders and their teams the ability to spot margin drift before it compounds.
The most effective dashboards track four metrics at minimum: blended contribution margin on first orders, new-customer CAC by channel, fulfillment cost per order, and AOV distribution by product line. Breaking these down by channel, SKU, and geography enables proactive decisions rather than retrospective analysis. A brand that sees fulfillment cost per order rising in a specific region can act on that signal before it erodes quarterly margin.
Cohort waterfall tables are the most powerful reporting format for investor conversations. They link acquisition cost, contribution margin, and revenue for each customer cohort over time. Investors now prioritize contribution margin and CAC payback over traditional LTV:CAC ratios, recognizing that near-term cash flow matters more than long-range projections. A founder who can show a clean cohort waterfall with consistent payback periods under 12 months is in a far stronger fundraising position than one presenting a high LTV:CAC ratio built on assumptions.
Unit economics should also be integrated into your growth narrative, not treated as a finance-only artifact. When product, marketing, and operations teams all understand the contribution margin implications of their decisions, the entire organization makes better tradeoffs. For brands tracking performance by channel, aligning marketing spend to channel-level CAC is the natural next step.
Key Takeaways
Startup brands that master unit economics gain a durable advantage: they scale with confidence, attract better investors, and avoid the margin erosion that kills growth-stage businesses.
| Point | Details |
|---|---|
| First-order profitability is the new standard | A positive contribution margin on the first sale is now the baseline for sustainable scaling. |
| True CAC is always higher than dashboards show | Include agency fees, creative costs, and influencer spend to get an accurate acquisition cost. |
| LTV must be bounded to 12 months | Use observed repeat purchase data, not projections, to keep LTV defensible and accurate. |
| Channel-level CAC drives real budget decisions | Blended CAC hides which channels work; break it down by channel and cohort every week. |
| Dashboards must be visible and frequent | Weekly unit economics reporting by channel, SKU, and geography prevents margin drift from compounding. |
Why most founders discover unit economics too late
The founders I respect most treat unit economics as a governance tool, not a reporting exercise. They do not wait for a quarterly finance review to find out their CAC crept up 20% while contribution margin held flat. They know it by Wednesday.
The uncomfortable pattern I see repeatedly is this: a brand hits $3M in revenue, growth looks strong, and the team celebrates. But underneath, the contribution margin on new customer orders is thin, the payback period is stretching past 18 months, and the LTV assumptions were built on the first six months of data from an unusually loyal early cohort. The topline number masked a structural problem that only unit economics would have caught.
The cultural shift that matters most is making these numbers visible to everyone who spends money, not just the CFO. When a performance marketer sees that their highest-volume channel has a CAC 40% above the company threshold, they make different decisions. When a product team sees that a new SKU is dragging down CM2 because of high return rates, they fix the product or kill it faster. Unit economics is not a finance artifact. It is the operating language of a brand that intends to survive.
The brands that scale past $50M without blowing up their margins are the ones that integrated unit economics into product, pricing, marketing, and fulfillment decisions from the beginning. That integration does not happen automatically. It requires a founder who insists on it.
— Matthew
How Cpgagent helps you build on solid unit economics
Cpgagent is built for CPG and FMCG founders who need more than a spreadsheet to manage unit economics at scale.

The Cpgagent platform gives you contribution margin tracking, channel-level CAC reporting, and cohort analysis tools designed for founders, not finance teams. You get real-time visibility into the metrics that determine whether your brand is ready to scale or needs to fix its cost structure first. The platform integrates with your existing tech stack and delivers data-backed insights without the overhead of a traditional agency. If you want to build a brand that grows profitably from the first order, Cpgagent gives you the tools to do it.
FAQ
What is unit economics in simple terms?
Unit economics measures the profit and cost associated with a single customer, order, or subscription. It tells you whether each unit of your business generates more value than it costs to acquire and serve.
What is a healthy LTV to CAC ratio for a startup brand?
A ratio of at least 3:1 is the minimum benchmark. A ratio of 5:1 or higher signals strong readiness to scale, and above 10:1 indicates significant valuation potential.
Why does contribution margin matter more than revenue?
Revenue tells you how much came in. Contribution margin tells you how much stayed after variable costs. A brand with high revenue and thin contribution margin is often losing money on every order it ships.
How do I calculate true CAC for my startup brand?
Add up all marketing spend for a period, including paid ads, agency fees, creative production, and influencer costs, then divide by the number of new customers acquired. Platform dashboards alone undercount true CAC by 30–60%.
How often should startup brands review their unit economics?
Weekly is the standard for brands serious about margin management. A daily or weekly dashboard broken down by channel, SKU, and geography gives you the visibility to catch problems before they compound.