

Net revenue management (NRM) is the discipline that increases the revenue you keep per unit by aligning pricing, promotion, pack, trade terms, and mix, not just growing gross sales. The primary payoff is margin recovery: brands that run NRM as a disciplined program typically claw back profit that promotions and trade deals quietly erode. What follows covers the five levers, the data and systems needed to run them and the operating cadence that turns analysis into decisions.
TL;DR:
- Many brands can increase their profitability by focusing on a small number of SKUs, customers, or promotions with the highest margin leakage.
- Connecting data sources such as sell-in, sell-out, trade spend, and shelf audits into one dashboard enables real-time NRM decision-making.
- Running pilot programs with clear deadlines and minimal scope helps build confidence and support for broader NRM initiatives.
- Price increases on key SKUs can unintentionally shift volume toward lower-margin packs; modeling interactions before changes prevents margin erosion.
- Routine weekly reviews with assigned ownership for each SKU or customer segment significantly improve margin recovery and sustainment.
Table of Contents
- What Is Net Revenue Management and Why It Matters for CPG
- The Five NRM Levers Brand Teams Actually Pull
- The Data and Systems Behind Net Revenue Analysis
- How to Improve Net Revenue: A Diagnose, Pilot, Scale Roadmap
- KPIs and Dashboards That Make Net Revenue Progress Visible
- When AI Tools and Fractional Leadership Speed Up NRM
- How External Forces Shape Net Revenue Management Strategy
- What Actually Separates Teams That Sustain NRM
- Put Your NRM Roadmap on Rails with CPG Agent
- Sources
- FAQ
What Is Net Revenue Management and Why It Matters for CPG
Net revenue management is the practice of optimizing what a brand actually keeps after discounts, promotions, and channel costs, rather than chasing top-line volume alone. It works across five connected areas: pricing and pack architecture, mix management, trade promotion, trade terms, and brand portfolio strategy. That's a meaningfully different lens than gross revenue, which counts every dollar shipped regardless of how much slips away in rebates, chargebacks, or deep promotional discounting.
The distinction matters because two brands can post identical gross sales and end up with wildly different profit. One might be selling at full trade terms with disciplined promo depth; the other could be funding volume through unchecked discounts that quietly cannibalize margin. NRM forces the question every brand manager should already be asking: what's the net revenue per unit, and is it moving in the right direction?
Where does NRM sit relative to revenue growth management (RGM)? Think of RGM as the broader umbrella, covering strategy, organization, and capability building, while NRM is the analytical and operational engine inside it, focused specifically on price and promotion mechanics.
The payoff is well documented. NRM is a discipline that integrates five levers to optimize net revenue per unit, and companies that build rigorous programs can see EBIT improvements in the range of roughly 2% to 5% of sales. That range depends heavily on how leaky the starting point is:
- Brands with fragmented trade terms and undisciplined promo calendars tend to land at the higher end of that range once they clean things up.
- Brands that already run tight pricing discipline see smaller, but still real, gains, often concentrated in one or two levers.
The Five NRM Levers Brand Teams Actually Pull
Each lever answers a different question about where margin leaks out, and treating them as a single toolkit rather than five separate projects is what separates a real NRM program from a pricing tweak.
- Pricing and pack architecture. This lever sets the actual price ladder across your SKU lineup, including psychological price thresholds ($4.99 versus $5.09) and pack-size plays like downsizing a large format or introducing a value pack to hold share against private label.
- Mix management. This is about steering volume toward your most profitable SKUs and channels through assortment decisions, not just tracking what sells. SKU rationalization belongs here: cutting the tail of low-velocity items that drain trade support without earning it back.
- Trade promotion management. This lever governs promo depth, frequency, and timing, measured against actual incremental lift rather than assumed lift. Running permissioned A/B tests on promo depth (20% off versus 30% off) on comparable stores often reveals that deeper discounts don't move enough incremental volume to justify the margin given up.
- Trade terms. This covers the rebate structures, off-invoice discounts, and logistics costs baked into customer-level agreements. A customer-level profit and loss statement frequently exposes that your biggest-volume account is also your least profitable one once slotting fees and logistics surcharges are counted.
- Brand portfolio strategy. This lever manages price tiers and positioning across a multi-brand portfolio so a premium line and a value line don't cannibalize each other, and so price increases on one SKU don't quietly push shoppers toward a lower-margin sibling.
Pro Tip: Never optimize one lever in isolation. A price increase on your hero SKU can look like a win on paper while quietly pushing volume toward a lower-margin pack size in your own portfolio. Model the interaction before you approve the change, not after the quarterly numbers come in.
The Data and Systems Behind Net Revenue Analysis
Running NRM well depends on connecting data that most CPG organizations already have, just scattered across disconnected systems. The core inputs are sell-in data (shipments to retailers), sell-out data (actual consumer purchases), trade spend records, field execution data from sales force automation (SFA) tools, image-recognition shelf audits, and customer-level profit and loss statements.
On the systems side, that means trade promotion management (TPM) or trade promotion optimization (TPO) platforms, SFA tools for field execution, image-recognition software for shelf compliance, and e-commerce sell-through reporting, ideally feeding into one combined dashboard rather than five logins nobody checks consistently. Connecting TPM, SFA, image-recognition shelf data, and sell-out data into one commercial view is what turns NRM from a quarterly retrospective into something you can act on in real time.
The analytical outputs that matter most are net revenue waterfalls (showing exactly where gross revenue erodes on its way to net), price elasticity tables by SKU and channel, and a clean net revenue per unit calculation you can drill into by customer or region.
Before any of that analysis is trustworthy, run a short governance checklist:
- Assign a single owner for each data source, so nobody assumes finance is reconciling trade spend when sales is
- Set a reconciliation cadence between sell-in and sell-out figures, at minimum monthly
- Flag and resolve mismatches between invoiced trade spend and what actually hit the P&L
- Confirm your reporting tools output net metrics, not just gross sales, since automation platforms need explicit configuration to surface net revenue per unit rather than defaulting to top-line figures
Retail-facing teams can also lean on tools like digital shelf analytics platforms to catch execution gaps on the top SKUs before they show up as a margin problem three months later.
How to Improve Net Revenue: A Diagnose, Pilot, Scale Roadmap
Most NRM programs stall because teams try to fix everything at once. A phased approach gets a working capability into place faster and earns the credibility to expand it.
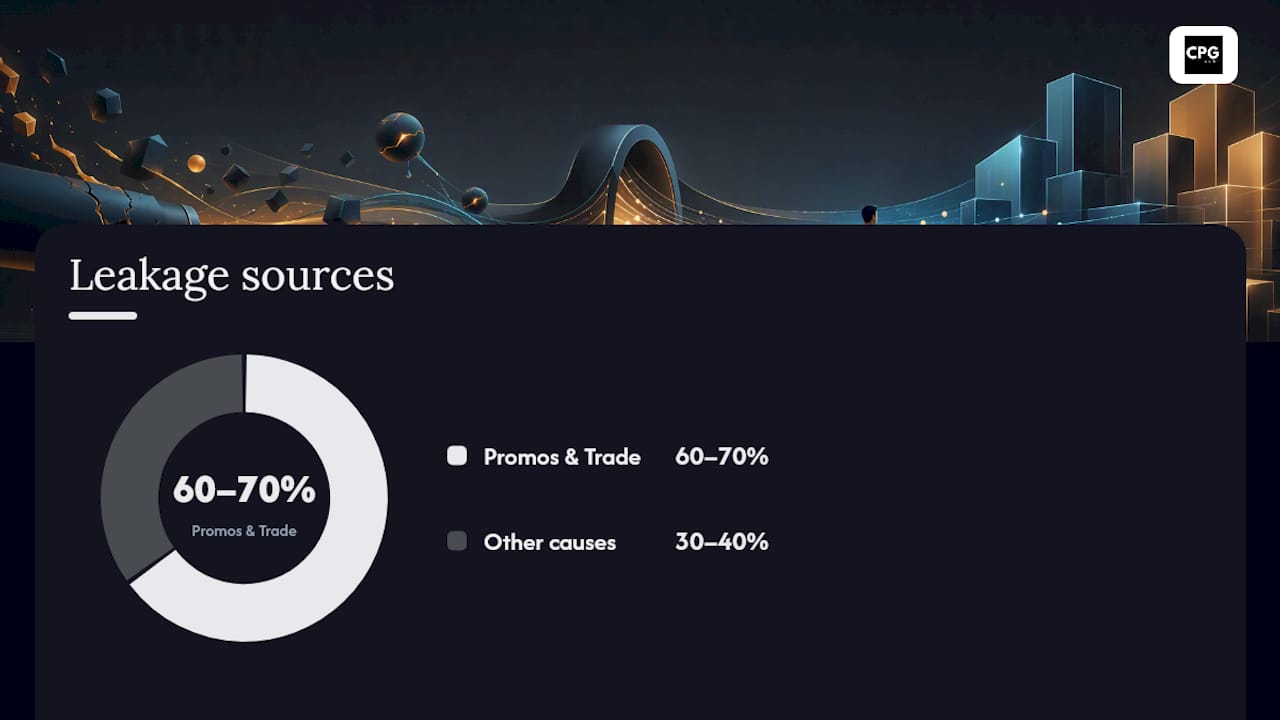
- Diagnose. Start by finding where leakage concentrates. Practitioner case studies consistently show that margin erosion clusters in a small number of SKUs, customers, or promotions, so pull your top 20 SKUs and top 10 customer accounts and build a net revenue waterfall for each. You'll usually find that 60% to 70% of your leakage traces back to a handful of promotional programs or trade agreements.
- Connect and pilot. Pick one lever or one customer segment and connect only the minimum data needed to test it. If promo ROI is the target, that means linking TPM data to sell-out figures for one region and running a quasi-experiment: compare stores running your standard promo cadence against a test group with adjusted depth or frequency.
- Scale and embed. Once a pilot proves out, expand it and lock in a recurring cadence. RGM Academy recommends an annual strategy cycle, quarterly cross-lever reviews, monthly KPI tracking, and continuous support for customer negotiations and new product pricing decisions.
Pro Tip: Give your first pilot a hard deadline, no more than 90 days. Programs that stay in "pilot mode" indefinitely rarely get the executive attention or budget needed to scale past one region or one customer.
Change management matters as much as the analytics. Decide upfront who owns pricing decisions, who owns trade terms negotiations, and who has final sign-off on promo calendars, because ambiguity here is what kills momentum after the pilot phase ends.
KPIs and Dashboards That Make Net Revenue Progress Visible
Five metrics carry most of the weight in an NRM dashboard: net revenue per unit, gross-to-net ratio (the percentage of gross revenue consumed by discounts and allowances), promo ROI, blended margin across the portfolio, and customer-level contribution margin.
The dashboard itself should lead with net revenue per unit at the top level, with drill-down paths to SKU, customer, and channel views underneath. That structure lets a brand manager spot a problem at the summary level and trace it to its source in two or three clicks instead of pulling five separate reports.
Companies with disciplined NRM programs report EBIT improvements of roughly 2% to 5% of sales, a range wide enough that measurement cadence, not just lever choice, often decides which end of it you land on.
Set a measurement cadence before you trust any single number: weekly sell-out checks, monthly KPI tracking, and quarterly reviews of how the levers interact. Watch for attribution traps too, a promo that looks like a win in isolation can be borrowing volume from a full-price SKU nearby, and only a channel-level and SKU-level view catches that.
- Net revenue per unit (the north star metric)
- Gross-to-net ratio, tracked by customer and channel
- Promo ROI, measured against incremental lift, not total volume
- Blended margin, watched for lever interaction effects
When AI Tools and Fractional Leadership Speed Up NRM
Analytics tools earn their keep on the repetitive, data-heavy parts of NRM: running price elasticity models across dozens of SKUs, building scenario comparisons for a trade terms renegotiation, or flagging which customer accounts have drifted into unprofitable territory. That's where a platform like Cpgagent's tools can compress weeks of spreadsheet work into days.
People still matter for the parts that require judgment: negotiating trade terms face to face, deciding which cross-lever tradeoffs a brand can live with, and building the internal alignment that makes a pricing change stick. A fractional CMO or senior advisor often earns their fee simply by setting the operating cadence and holding cross-functional owners accountable to it.
- AI tools speed elasticity modeling, scenario testing, and persona-driven pricing checks
- Fractional leadership sets decision rights and keeps the weekly/monthly cadence from slipping
- The combination shortens time-to-value without requiring a full agency retainer
How External Forces Shape Net Revenue Management Strategy
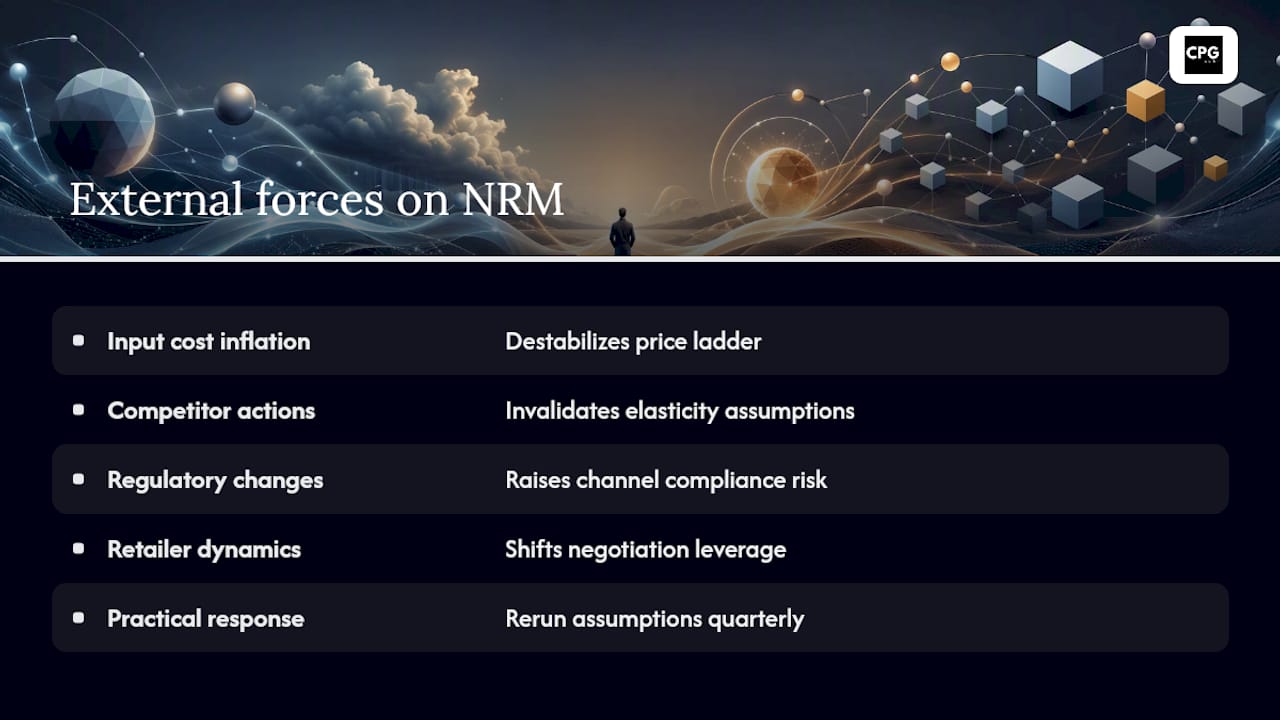
NRM decisions never happen in a vacuum. Input cost inflation, retailer consolidation, and shifting consumer price sensitivity all move the ground under a pricing model that looked solid six months earlier. A price ladder built for a low-inflation environment can turn a modest increase into a shelf-price jump that pushes shoppers straight to private label.
Competitor actions carry similar weight. If a rival brand runs a deep, sustained promotion in your category, your elasticity assumptions from last quarter may no longer hold, and a promo ROI model that ignored competitive response will overstate your own program's effectiveness. That's why mature NRM teams rerun elasticity checks whenever a major competitor shifts pricing or promotional cadence, not just on the annual planning cycle.
Regulatory changes add another layer, particularly around deceptive pricing rules, minimum advertised price policies, and country-specific promotional disclosure requirements. A trade promotion that's standard practice in one retail channel can trigger compliance issues in another, especially as more states tighten rules around reference pricing and discount claims.
Retailer-specific dynamics matter too. A major account consolidating its supplier base, or shifting toward algorithmic replenishment, changes how much leverage you have in a trade terms negotiation. Brands that treat trade terms as fixed annual contracts rather than living agreements tend to miss these shifts until a renegotiation forces the issue.
The practical response isn't a bigger model, it's a shorter feedback loop. Teams that rerun their core NRM assumptions quarterly, rather than annually, catch these shifts before they show up as a margin surprise in the following year's plan.
What Actually Separates Teams That Sustain NRM
The biggest mistake brand teams make with net revenue management is treating it as a quarterly reporting exercise rather than an operating habit. A dashboard that gets reviewed once a quarter tells you what happened; it rarely changes what happens next.
The teams that sustain NRM run a weekly sell-out and action review with named owners for each SKU or customer segment showing leakage. It's a 20-minute meeting, not a formal deck, and it forces someone to answer for a number instead of just reporting it.
Try this over the next seven days: pull your top five SKUs by trade spend, calculate net revenue per unit for each, and assign one owner to explain any decline by next week. That single habit, repeated, does more for margin recovery than a perfect annual model that nobody revisits until Q4.
— Matthew
Put Your NRM Roadmap on Rails with CPG Agent
A specialized platform is available for brand teams that need the NRM data pipeline, elasticity modeling, and decision cadence described above without hiring a full analytics department or signing a year-long agency contract. The platform's AI-driven tools handle the repetitive analytical lift, pricing scenario checks, persona-driven elasticity testing, and rapid pack-and-price modeling, so your team spends time on decisions instead of spreadsheets.
For the parts of NRM that need a human in the room, trade terms negotiations, cross-functional alignment, embedding a weekly cadence, Fractional CMO and senior marketing leadership support services can plug directly into your existing team.
- Rapid elasticity and scenario modeling that maps to the pricing and pack lever
- Persona-driven pricing checks that support mix and portfolio decisions
- Fractional advisory to set decision rights and sustain the operating cadence
If your net revenue analysis is stuck in disconnected spreadsheets, visit the Cpgagent platform to see how the tools and advisory options map to the roadmap above, and start scoping your first 90 day pilot.
Sources
- How to Close Net Revenue Management Gaps: Real FMCG Cases — SoftserveBS
- A guide to revenue optimization for businesses — Stripe
- Net Revenue Management (NRM): The Discipline Behind RGM — RGM Academy
FAQ
What Is Net Revenue Management?
Net revenue management is the discipline of optimizing pricing, promotion, pack, trade terms, and mix to increase the revenue a brand keeps after discounts and allowances, rather than just growing gross sales.
How Do You Calculate Net Revenue?
Net revenue equals gross revenue minus returns, discounts, and allowances, and most brand teams also track it on a net revenue per unit basis to compare SKUs fairly.
What Does Revenue Management Do?
Revenue management aligns pricing, promotional spend, and channel mix decisions to maximize what a business earns from existing demand, using elasticity data and customer-level profitability to guide those calls.
What's the Difference Between Gross Revenue and Net Revenue Reporting?
Gross revenue counts total sales before deductions, while net revenue subtracts returns, discounts, and trade allowances, giving a far more accurate picture of what a brand actually keeps per unit sold.
Where Should a Brand Manager Start With NRM?
Start by diagnosing where leakage concentrates, typically a small set of top SKUs, customer accounts, or promotions, then pilot one lever with the minimum data needed before scaling to a quarterly review cadence.