

Most CPG market-sizing exercises land somewhere in the low hundreds of billions to over a trillion dollars, depending on scope, with mid-single-digit CAGRs typical across major published forecasts. The right number depends on what you include: geography, channel, and category boundaries all move the total. This guide gives you the methodology, a reusable TAM/SAM/SOM template, primary data sources, and a validation checklist so you can build a figure you can actually defend.
TL;DR:
- For emerging categories without historical data, demand-side sizing provides the most accurate estimate by directly measuring need-state prevalence and willingness-to-pay.
- When sizing a mature category, using a well-documented top-down estimate from a credible source saves time but requires careful scope alignment.
- Combining at least two methods, such as top-down and bottom-up, improves estimate reliability by revealing assumption discrepancies within 20 to 30 percent.
- Clearly defining scope decisions on product groups, channels, packaging, private label inclusion, and geography before data collection is essential for auditability and accuracy.
- Building scenario models with explicit sensitivity ranges on key assumptions like purchase frequency and price helps stress-test market forecasts and supports decision confidence.
Table of Contents
- What Is Market Sizing CPG and What Does the Data Say Right Now?
- How Does CPG Segmentation Change the Sizing Math?
- Top-Down vs. Bottom-Up vs. Demand-Side: Which Method Fits Your Project?
- How Do You Build a TAM/SAM/SOM Model for a CPG Category?
- How Should You Build Forecast Scenarios and Stress-Test Assumptions?
- How Does a CPG Team Apply This Template With Modern Tools?
- What Analysts Get Wrong About Market Sizing (and How to Fix It Fast)
- Run Repeatable CPG Sizing Without Rebuilding the Model Every Time
- Sources
- FAQ
What Is Market Sizing CPG and What Does the Data Say Right Now?
Market sizing CPG means estimating the total addressable revenue for a consumer packaged goods category, product line, or geography, using some blend of top-down industry data and bottom-up unit economics. The trick isn't finding a number.
Published estimates for the global CPG market vary widely by source because they scope things differently. One tracker might fold in only packaged food and beverage. Another adds personal care, household chemicals, and over-the-counter health products. A third splits by channel and only counts retail scan data, missing direct-to-consumer and food service entirely. None of these are wrong. They're just answering different questions.
Here's what tends to hold across most credible reports:
- Global CPG totals published by industry research firms generally sit in the trillions when you include food, beverage, personal care, and household categories together.
- CAGR estimates for the broader sector typically land in the low-to-mid single digits, with faster growth in emerging-market regions and slower growth in mature Western markets.
- Regional splits matter enormously. North America and Europe tend to show slower unit growth but higher price realization; Asia-Pacific markets often show the opposite pattern.
- Category-level growth diverges hard from the headline number. Functional beverages and better-for-you snacking often outpace the sector average by a wide margin, while some legacy household categories grow closer to flat.
Syndicated retail scan data and industry trackers are the most common anchors for headline totals, and NIQ's own guidance on CPG market sizing notes that differences across reports usually come down to scope and segmentation choices rather than disagreement about underlying demand.
So which number should you use? It depends on the job. If you're building an internal strategic plan or a board deck, use a conservative, well-documented total from a report whose scope you can explain in one sentence. If you're pitching investors on a new brand or subcategory, you want a bottom-up number specific to your actual addressable slice, not the trillion-dollar headline that has nothing to do with your shelf space. And if you're doing competitive benchmarking, you need a number scoped exactly the way your competitor set is scoped, or the comparison is meaningless.
How Does CPG Segmentation Change the Sizing Math?
Segmentation is where most sizing exercises quietly go wrong. Two analysts can use the same underlying data and still produce different totals just because they drew the category lines differently.
- Product group first. Start by fixing which broad groups you're including: food and beverage, personal care and beauty, household and cleaning products, and over-the-counter health items are the four pillars most reports use. Decide explicitly whether pet care, baby products, or vitamins count as their own bucket or roll into an adjacent one.
- Channel scope second. Traditional retail scan data (grocery, mass, club, drug) captures a large share of CPG sales but misses e-commerce pure-plays, direct-to-consumer subscription revenue, and food service entirely. If your category has meaningful DTC volume, a scan-only total will understate the real market, sometimes significantly.
- Packaging and format third. A "snacks" category sized around bagged chips looks very different from one that includes single-serve, multipack, and bulk club formats, because price per ounce and purchase frequency shift across formats.
- Private label treatment fourth. Decide up front whether store-brand and private-label volume counts toward the category total or gets carved out. This matters most in categories like paper goods and basic dairy, where private label share can exceed 30% in some retailers.
- Geographic boundary last. Fix whether you're sizing North America, a single country, or global, and hold that boundary constant across every input you pull in later.
Write these five decisions down before you touch a single data source. A scope checklist that lives in a shared doc, not in your head, is what lets someone else audit your number six months later and understand why it is what it is.
Top-Down vs. Bottom-Up vs. Demand-Side: Which Method Fits Your Project?
Three approaches dominate CPG market sizing, and picking the wrong one for your situation is the single most common reason a sizing exercise falls apart under scrutiny.
Top-down sizing starts with a published industry total, usually from a syndicated tracker or research firm, and works down to your slice by applying share percentages. It's fast and it's easy to defend to a skeptical executive because the anchor number came from a name they recognize. The limitation shows up fast with genuinely new categories or emerging subsegments: if the category doesn't have its own line item in existing reports yet, there's nothing to slice down from. Functional mushroom coffee, for instance, doesn't have a clean decade of scan history to anchor a top-down estimate.
Bottom-up sizing builds the number from the ground up: number of customers or households, multiplied by purchase frequency, multiplied by price per unit. Bottom-up market sizing uses customer counts times realistic revenue per customer rather than working down from an industry aggregate, and that structure is exactly why investors tend to trust it more. You can trace every input back to a real number: how many households buy this type, how often, at what price. The explicit formula is customer count multiplied by frequency multiplied by price per unit, which for a retail outlet-based business becomes outlet count times average revenue per outlet instead.
Demand-side sizing is the right call for categories with no scanner footprint at all, where neither top-down nor conventional bottom-up data exists. This approach measures need-state prevalence (how many people report the problem your product solves), purchase frequency, and willingness-to-pay directly through consumer research. Demand-side sizing for a genuinely new CPG category relies on need-state prevalence, frequency, and willingness-to-pay because syndicated trackers don't have a category code for something that didn't exist a year ago. It's slower and more expensive to run than pulling a report off a shelf, but it's the only method that doesn't quietly assume your new product will behave like an adjacent category that may have nothing in common with it.
Here's how to choose in practice:
- Use top-down when the category is mature, well-tracked, and you need a fast, credible headline number for a strategy document.
- Use bottom-up when you need investor-grade precision on a specific addressable slice, especially for a new brand or a narrow subcategory.
- Use demand-side when the category is new enough that scanner data simply doesn't exist yet, or when you're testing a need that doesn't map cleanly onto an existing aisle.
- Combine at least two methods whenever the stakes are high. A single-method estimate is a guess with confidence; two independent methods that land in the same range is evidence.
The pros and cons rarely get stated plainly, so here they are. Top-down is fast but blind to new categories and easy to game by picking a favorable published source. Bottom-up is defensible and auditable but slow to build and highly sensitive to your frequency and price assumptions. Demand-side is the only option for true white space but depends entirely on survey quality and sample size, and a poorly worded need-state question can inflate your addressable market by a wide margin.
How Do You Build a TAM/SAM/SOM Model for a CPG Category?
Here's the workflow, in order. Skipping steps is how sizing exercises become unauditable six months later when someone asks you to defend the number.
- Define scope first. Write down geography, category boundaries, channel inclusion, and time horizon before touching any data. This single step prevents more sizing errors than any calculation that follows it.
- Select your segments. Decide which product groups and packaging formats count, using the scope checklist from the segmentation section above.
- Gather inputs from at least two independent sources. Pull a top-down anchor from a syndicated or industry report, and build a parallel bottom-up estimate from household counts, purchase frequency, and price.
- Compute TAM, SAM, and SOM explicitly. TAM is the full addressable category at your defined scope. SAM narrows that to the segment your product or brand can realistically compete in, given channel presence and geography. SOM is the slice you can capture given distribution, marketing spend, and competitive intensity, usually expressed as a percentage of SAM over a defined time window.
- Express each figure in units that mean something for CPG, not just dollars. Household incidence rate, units sold per year, and retailer revenue per door all translate a dollar figure into something a retail buyer or category manager can sanity-check against their own shelf data.
- Sanity-check against supply-side data. Compare your bottom-up SOM against actual competitor revenue where it's disclosed or estimable. If your SOM implies you'd need to outsell the category leader within two years, the model has a problem somewhere.
- Run sensitivity analysis on your highest-leverage assumptions before you present a single number to anyone.
A structured worksheet makes every one of these steps auditable. A market-sizing template that records both top-down and bottom-up estimates alongside documented assumptions is the single highest-leverage habit an analyst can build, because it turns a one-time estimate into something a colleague can pick up and reproduce.
For every line item in your model, track four fields: the source of the input, the date it was pulled, the rationale for using it, and a sensitivity ranking (high, medium, or low impact on the final number). This assumption-tracking discipline is what separates a defensible model from a spreadsheet full of numbers nobody can explain a year later. If you're mapping purchase occasions and need-states as inputs to your frequency assumption, a consumer journey framework gives you a structured way to convert qualitative behavior into a frequency number you can defend.
Pro Tip: Keep your top-down and bottom-up estimates within a plausible reconciliation band, generally within 20 to 30 percent of each other. If they diverge further, don't average them and move on. Find the specific assumption driving the gap. Nine times out of ten it's a channel-scope mismatch or a stale price assumption, not a fundamental disagreement about the size of the opportunity.
How Should You Build Forecast Scenarios and Stress-Test Assumptions?
A single-point market-size forecast is a liability, not a deliverable. Build three scenarios instead: base, optimistic, and pessimistic, each driven by explicit changes to your highest-leverage variables rather than an arbitrary percentage swing.
Start by identifying which three or four assumptions move your final number the most. In most CPG bottom-up models, that's household penetration rate, purchase frequency per year, and average price per unit. Sensitivity analysis should stress-test the highest-leverage assumptions, typically need-state prevalence, purchase frequency, and willingness-to-pay, across optimistic, base, and pessimistic bands rather than treating every input as equally uncertain.
Practical stress-test ranges look something like this:
- Penetration: test a spread reflecting realistic best-case and worst-case distribution outcomes, not just plus or minus 10%.
- Price: model at least one scenario reflecting promotional intensity, since CPG categories rarely sell entirely at list price.
- Frequency: stress-test seasonal categories separately from year-round staples, since a single average frequency number can badly mislead for anything with a holiday or weather-driven purchase pattern.
Present forecast bands as a range with the base case clearly labeled, not as three disconnected numbers. Stakeholders generally want one number to anchor on and a sense of how much confidence to place around it, not a spreadsheet of scenarios with no recommendation attached.
The most common mistake is leaning on a single data source for the entire model, which means every error in that source propagates uncorrected through your whole forecast. The second is ignoring distribution constraints: a SOM projection that assumes national distribution in year one when you currently have regional shelf space is fiction, not forecasting.
How Does a CPG Team Apply This Template With Modern Tools?
Consider a hypothetical: a brand team is evaluating a new functional-snack subcategory with no clean scanner history. The team can't top-down its way to a number because the category barely exists in syndicated data yet, so the work has to start demand-side.
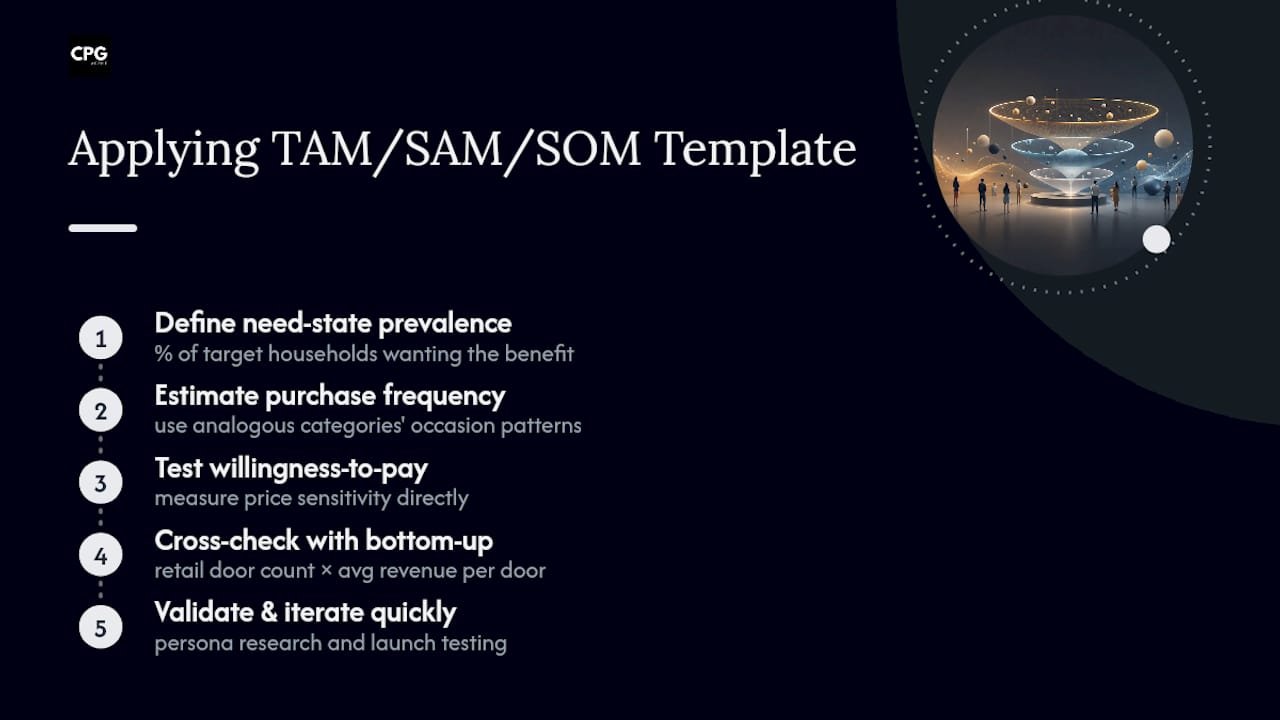
The process runs in stages. First, define need-state prevalence: what percentage of the target household base reports wanting this specific benefit. Second, estimate purchase frequency from analogous categories with similar occasion patterns. Third, test willingness-to-pay directly rather than assuming price parity with adjacent products. Fourth, cross-check the resulting TAM against a bottom-up build using estimated retail door count and average revenue per door in comparable subcategories.
The categories that get sizing most wrong are the ones where analysts borrow frequency and penetration assumptions from an adjacent category without testing whether the need is actually the same. A protein bar buyer and a functional-mushroom-coffee buyer do not behave the same way, even though both sit in "functional food and beverage."
Persona research and structured launch validation shorten this cycle considerably, because they replace weeks of ad hoc assumption-building with a repeatable process for testing need-state and price sensitivity before a single unit ships. Tools like Cpgagent's platform are built around exactly this kind of assumption tracking and rapid validation, which matters more than raw computing power once you're working with a category that has no historical data to anchor to.
Pro Tip: Before you commit to a full bottom-up build, run a quick top-down sanity check against the broadest plausible adjacent category, even if it's imprecise. A rough ceiling check catches wildly optimistic demand-side assumptions before you've invested weeks refining a model built on a number that was never realistic.
What Analysts Get Wrong About Market Sizing (and How to Fix It Fast)
The biggest mistake I see is analysts anchoring to a single published total and treating it as ground truth instead of a scoped estimate someone else made under someone else's assumptions. Fix it by always asking what's excluded, not just what's included.
The second mistake is skipping the reconciliation step between top-down and bottom-up numbers. If you only build one, you have no way to catch a bad assumption before it reaches a decision-maker.
The third is over-indexing on precision at the expense of speed. A directionally correct number delivered this week beats a perfectly reconciled model delivered after the budget decision has already been made. Run a fast top-down check first, then invest deeper bottom-up or demand-side work only where the decision genuinely hinges on precision. Targeted surveys on the two or three assumptions with the highest sensitivity ranking will save more time than trying to validate everything equally.
— Matthew
Run Repeatable CPG Sizing Without Rebuilding the Model Every Time
This approach turns the sizing process described above into something your team can rerun in days instead of rebuilding from scratch every quarter. The tools include assumption-tracking, persona research, and launch-validation features to handle the parts of this workflow that eat the most analyst time: documenting sources, testing need-state and frequency assumptions, and cross-checking bottom-up figures against real demand signals.
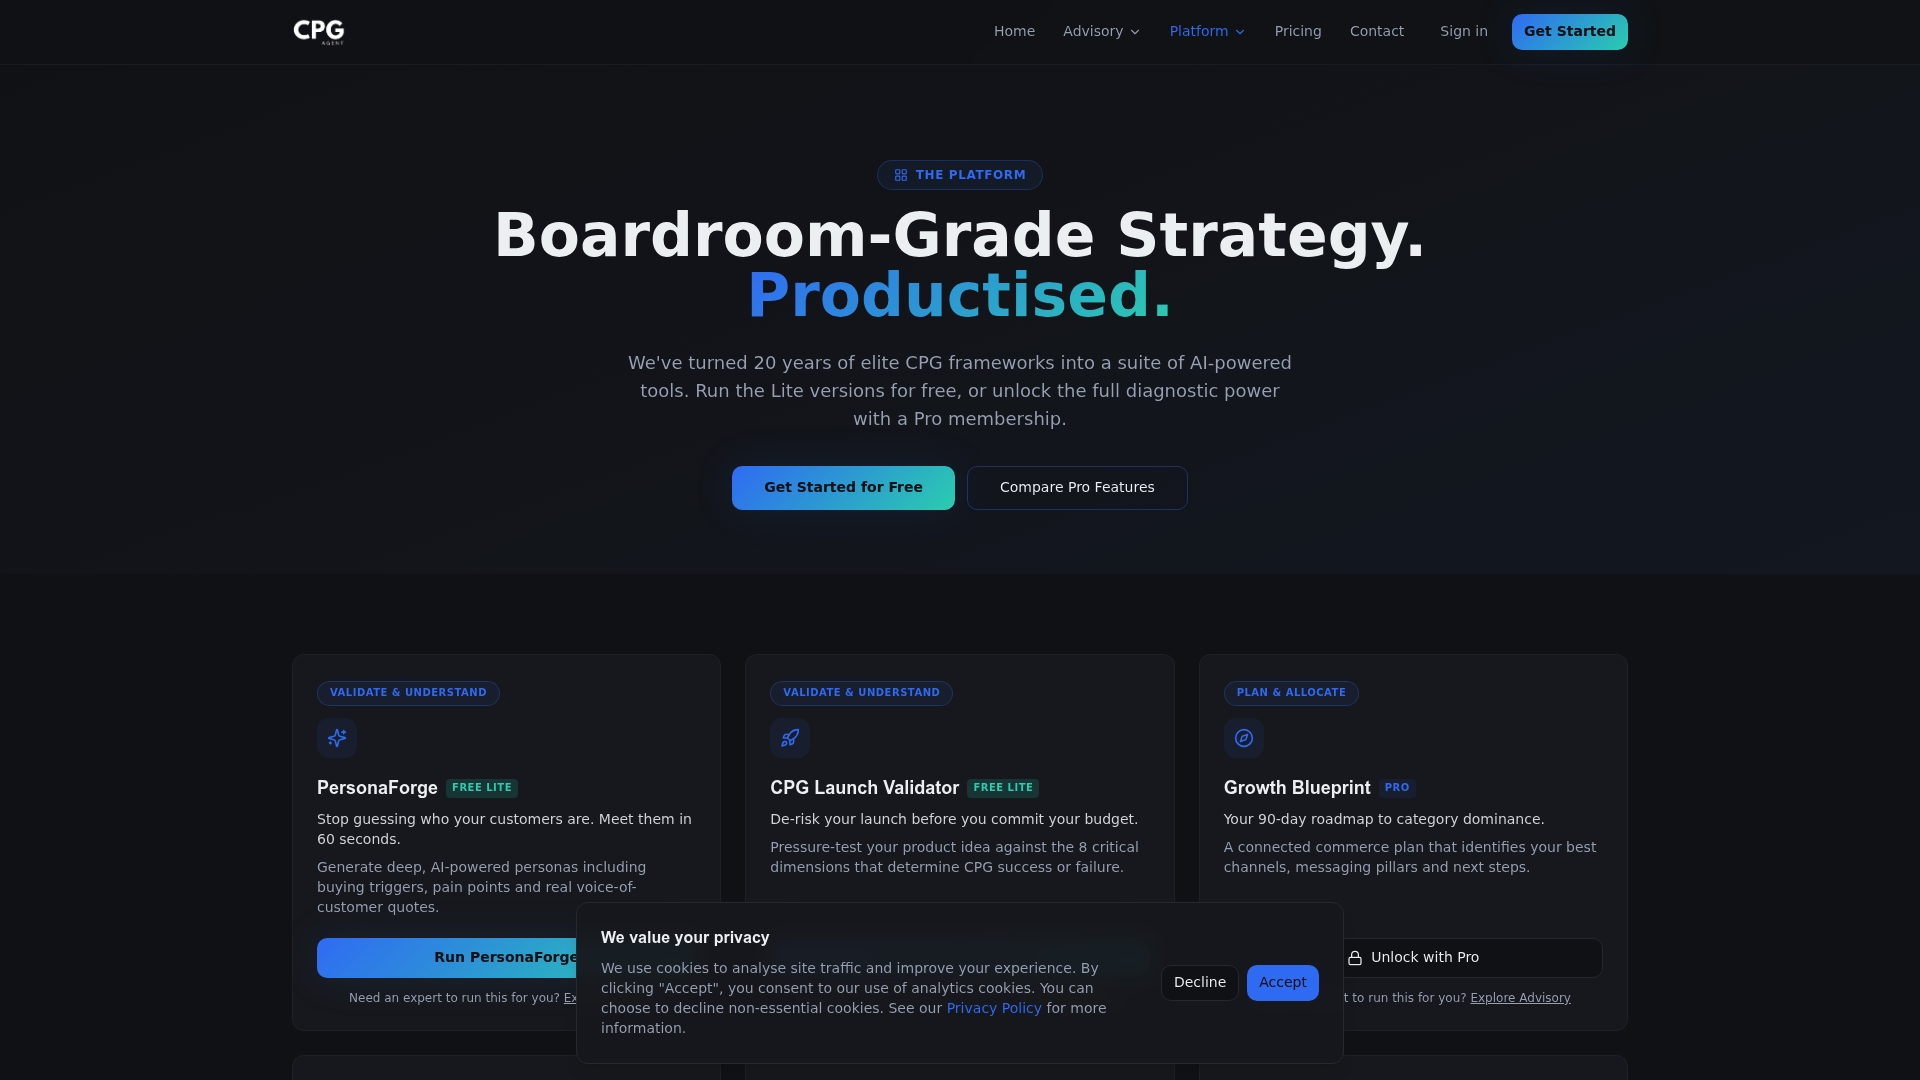
Rather than a generic dashboard, it's built around the same discipline this guide walks through: define scope, gather inputs from multiple sources, track assumptions with dates and rationale, and stress-test before you commit budget to a launch. If you're evaluating a new subcategory or refreshing a sizing model that's gone stale, visit the Cpgagent platform to see the tools and template resources built for exactly this kind of repeatable work.
Sources
Good sizing rarely comes from one source. It comes from triangulating several imperfect ones until the gaps in each get covered by the strengths of another.
- Bottom Up Market Sizing: Step-by-Step Approach for Reliable Forecasts - EasyVC
- Market Sizing for a New CPG Category: Research-Backed Approaches
- Market Sizing Template (TAM/SAM/SOM) - IdeaPlan
- How to conduct CPG market sizing - NIQ
The practical move is fusion, not selection. Pull your headline anchor from a syndicated source, validate the floor against government trade data, and use commercial signals to catch what both of those miss, particularly DTC and emerging-channel volume. Track the publication date on every input. A scan-data report from three years ago is close to useless for a category that has shifted as fast as functional beverages or clean-label snacking has recently.
FAQ
What is the market size of the CPG industry?
Published estimates vary by scope, but most credible industry reports put the global CPG market in the trillions of dollars when food, beverage, personal care, and household categories are combined, with CAGR forecasts typically in the low-to-mid single digits.
What is market sizing?
Market sizing is the process of estimating the total addressable revenue or unit volume for a category, product, or business opportunity, typically using top-down industry data, bottom-up unit economics, or demand-side consumer research, depending on how mature and well-tracked the category already is.
Does McKinsey ask market sizing questions in interviews?
Yes, market-sizing questions are a standard part of McKinsey's case-interview process, used to test whether a candidate can structure an ambiguous problem, make reasonable assumptions, and work through a calculation logically under time pressure.
Does BCG ask market sizing questions in interviews?
Yes, BCG also uses market-sizing questions as part of its case-interview format, with the same emphasis on structured reasoning and clearly stated assumptions rather than arriving at one single "correct" number.
Should I use top-down or bottom-up sizing for a new CPG product?
Use bottom-up or demand-side sizing for a genuinely new product or subcategory, since top-down methods rely on published category data that often doesn't exist yet for something new, and demand-side sizing captures need-state and willingness-to-pay directly from consumers.