

Velocity tracking is the practice of measuring how fast a product actually sells at store level, usually expressed as units sold per store per week, or U/S/W. It is the single number retail buyers watch most closely, because it tells them whether your product earns the shelf space it occupies.
- Buyer implication: a retail buyer uses velocity, not shipments, to decide facings, promo support, and delisting risk.
- Reporting cadence: most teams track weekly numbers but evaluate trends over 12, 24, or 52-week windows.
- Quick action: ask your broker for POS-level velocity data this week, not distributor shipment reports, which routinely overstate real sell-through.
Key Takeaways
Retail velocity, measured as units sold per store per week, is the metric buyers use to decide facings, promotions, and delisting, and it only tells the truth when calculated with the right data source and lookback window.
| Point | Details |
|---|---|
| Know the formula | U/S/W equals total units sold divided by store count divided by weeks measured. |
| Match method to SKU stage | Use 12-week windows for launches, seasonal comparisons for seasonal items, and 24 to 52-week averages for established SKUs. |
| Trust POS data first | Rank sources as POS, then syndicated data, then distributor reports, then manual audits. |
| Watch for phantom inventory | Cross-check sellable velocity against raw velocity to catch availability problems masquerading as low demand. |
| Fix availability before merchandising | Out-of-stocks are the fastest and most common lever for lifting velocity at the shelf. |
| Use the right tools | Cpgagent's platform surfaces sellable velocity and hot-store signals to prioritize action ahead of category reviews. |
Table of Contents
- What Is Velocity Tracking in Retail, and Why Does It Matter?
- Why Do Retail Buyers Care So Much About Velocity?
- How Should You Calculate Velocity for Different SKU Types?
- Where Does Velocity Data Actually Come From?
- How Often Should You Report Velocity, and What Benchmarks Apply?
- What Actions Actually Move Velocity at the Shelf?
- What Measurement Traps Distort Velocity Numbers?
- How Do You Present Velocity in a Buyer Conversation?
- How Are Modern Tools Changing Velocity Tracking?
- How Cpgagent Turns Velocity Data Into Shelf Action
- Sources
- FAQ
What Is Velocity Tracking in Retail, and Why Does It Matter?
Velocity tracking answers one question: how fast does a product move off the shelf, per store, per week? That's it. Everything else, from planogram placement to promotional calendars, gets built on top of that number.
Retailers don't care how many units you shipped to their warehouse. They care what left the shelf. That distinction separates velocity from revenue or shipment data, and it's why buyers treat it as the primary scorecard for every SKU in a category.
The formula:
- Units per store per week (U/S/W) = total units sold ÷ number of stores selling it ÷ number of weeks
- Dollars per store per week ($/S/W) = total dollar sales ÷ number of stores ÷ number of weeks
Worked example: Say your granola bar sold 4,800 units across 80 stores over 12 weeks. That's 4,800 ÷ 80 ÷ 12 = 5 U/S/W. If a competing SKU sells fewer units but at double the price, dollar velocity often tells the more useful story, especially when comparing different pack sizes or price tiers within the same set.
Why Do Retail Buyers Care So Much About Velocity?
Buyers run categories on a simple, almost mechanical logic: low velocity leads to fewer facings, fewer facings lead to less promotional support, and persistent underperformance leads to delisting. It's a downward spiral that starts quietly, often before a brand manager notices.
A product sitting at 2 U/S/W in a category where the average is 6 will get flagged at the next reset, regardless of how strong shipment numbers looked to the sales team. Buyers evaluate against category benchmarks, not against your internal targets.
- Revenue can look healthy while velocity signals decline, especially if price increases mask falling unit sales.
- Shipment volume tells you what left your warehouse. Velocity tells you what customers actually bought.
- Category reviews weight trailing velocity trends over single-quarter spikes, so a promo-driven bump rarely saves a chronically slow SKU.
How Should You Calculate Velocity for Different SKU Types?
Not every SKU deserves the same calculation method. A seasonal item and a five-year steady seller behave differently, and forcing one formula on both distorts the picture.
The two biggest calculation decisions are whether to include or exclude zero-sales weeks, and how long a lookback window to use. Including zero-sales weeks (common in store-level calculations used by platforms like Crisp) captures true average performance, including stockouts. Excluding them isolates velocity for weeks the product was actually available, which better reflects demand for new items still building distribution.
- New launches: use a shorter 12-week window and exclude zero-sales weeks caused by phased rollout.
- Seasonal SKUs: compare same-season windows year over year rather than a rolling 52-week average.
- Established SKUs: a 24 or 52-week average smooths out one-off promotional spikes.
| SKU type | Recommended window | Zero-sales weeks |
|---|---|---|
| New launch | 12 weeks | Exclude (rollout gaps) |
| Seasonal | Same-season comparison | Include if in full distribution |
| Established | 24 to 52 weeks | Include for realistic baseline |
Where Does Velocity Data Actually Come From?
Data source determines whether your velocity number reflects reality or wishful thinking. Accuracy drops the further you get from the register.
- POS data directly from the retailer is the gold standard. It reflects actual scans at checkout.
- Syndicated data (aggregated across retailers) is nearly as reliable and useful for benchmarking against category averages.
- Distributor reports track what shipped to the store, not what sold, and can overstate velocity when backroom stockpiles up.
- Broker pulls vary in quality depending on how closely the broker audits store-level movement.
- Manual store audits are the least scalable but useful for spot-checking suspicious numbers.
- Ask your broker specifically for scan-based POS velocity, not shipment volume.
- Cross-check any distributor number against a syndicated source before presenting it internally.
How Often Should You Report Velocity, and What Benchmarks Apply?
Weekly dashboards catch problems early. Trend reviews every 12, 24, and 52 weeks catch the slower stories, like gradual decline after a promotional bump wears off.
Benchmarks vary enormously by category and retailer, so treat any number you hear as an example, not a rule. A shelf-stable snack might need 3 to 5 U/S/W to survive a reset in one chain, while a refrigerated item in a smaller set might only need 1 to 2. The only reliable benchmark is your specific category average at your specific retailer.
- Run a weekly velocity check for early warning signs.
- Review 12-week trends monthly to catch short-term drift.
- Review 24 and 52-week trends quarterly ahead of category resets.
- Flag any SKU trending below the category average for two consecutive reporting periods.
What Actions Actually Move Velocity at the Shelf?
Fixing velocity starts with availability, not marketing. A product that isn't on the shelf can't sell, no matter how good the campaign behind it is.
- Fix availability first. Out-of-stocks are the single most common, and most fixable, cause of underperformance.
- Improve merchandising and facings. Secondary placement and eye-level positioning can lift velocity meaningfully without touching price.
- Test pricing and promotions. Price elasticity varies by category; test before rolling changes chain-wide.
- Expand distribution density only after velocity proves out in your current store set.
- Audit planogram compliance. A product missing from its assigned slot shows up as a velocity problem when it's really an execution problem.
Pro Tip: Run a controlled pilot before rolling any fix chain-wide: pick a small set of representative stores, track sellable velocity for 12 weeks, apply your fix to half of them, and compare the lift before committing budget everywhere.
What Measurement Traps Distort Velocity Numbers?
Phantom inventory, where the system says a product is in stock but it's actually missing from the shelf, is one of the most common and hardest to spot velocity traps. It shows up as flat or declining sales when the real problem is availability.
Other traps: conflating shipments with actual sell-through, comparing velocity across different pack sizes without normalizing to dollars, and dropping zero-sales weeks that actually represent real stockouts rather than true lack of demand.
- Sellable velocity excludes periods when a product wasn't actually available to buy, giving a cleaner read on true demand.
- Detect phantom inventory by cross-referencing POS scans against physical shelf audits at a sample of stores.
Pro Tip: If a SKU's sellable velocity is meaningfully higher than its raw velocity, you likely have an availability problem, not a demand problem, and that changes what you fix first.
How Do You Present Velocity in a Buyer Conversation?
A strong buyer pitch leads with velocity, not aspiration. Buyers have seen enough decks full of brand story and not enough numbers.
- Open with current velocity versus category average.
- Show the trend line over 12 and 24 weeks, not just a snapshot.
- Include sellable velocity if stockouts have masked true demand.
- State the remediation plan for any underperforming location.
- Close with a specific ask: additional facings, promotional slot, or a defined test period.
Frame any improvement as incremental revenue per store per week. Buyers respond to a clear uplift number tied to a specific action, not a general growth story.
How Are Modern Tools Changing Velocity Tracking?
Retail is shifting from periodic manual counts toward near-real-time inventory intelligence, and that shift changes how reliable your velocity number can be.
- Item-level RFID and IoT provide continuous visibility into what's actually on the shelf versus the backroom.
- Camera and shelf AI flag out-of-stocks and planogram gaps before they show up as a velocity dip weeks later.
- Automated replenishment closes the gap between a sale and a restock, protecting velocity from availability failures.
AI-powered shelf monitoring can push inventory accuracy toward 95%, and moving accuracy from a typical baseline into that range can cut carried inventory by 30 to 60% while increasing real sell-through. The Cpgagent platform helps brand teams turn that kind of shelf-level signal into a prioritized action list.
Why velocity should outrank vanity metrics
I'd rather see a brand manager obsess over sellable velocity than celebrate a shipment spike that never turns into real sell-through. The trade-off is real: a short-term promo can juice velocity temporarily, but if availability isn't fixed underneath it, the number collapses the week the discount ends.
How Cpgagent Turns Velocity Data Into Shelf Action
Knowing your velocity number is the easy part. Acting on it, fast enough to matter before the next category review, is where most brand teams fall behind.
Cpgagent's retail audit and shelf monitoring tools surface sellable velocity alongside raw velocity, flag phantom inventory before it costs you a reset, and highlight "hot stores" worth prioritizing for replenishment or promotion. Our fractional CMO and growth advisory services then help you build the buyer story around that data, so the numbers turn into facings and distribution, not just a report nobody acts on. If you're heading into a category review or planning a retail expansion pitch, start by reviewing the Cpgagent platform to see how automated shelf intelligence fits into your current stack.
Sources
- Velocity (SPINS CPG learning center)
- What Is Retail Velocity? What CPG Brands Need to Know | JDALL
- Item-level inventory intelligence for modern retail | Wiliot
FAQ
What Is Velocity in Retail Sales?
Retail velocity measures how fast a product sells at store level, typically expressed as units per store per week, and it's the number buyers use most when deciding shelf space and promotional support.
What Is Velocity Tracking?
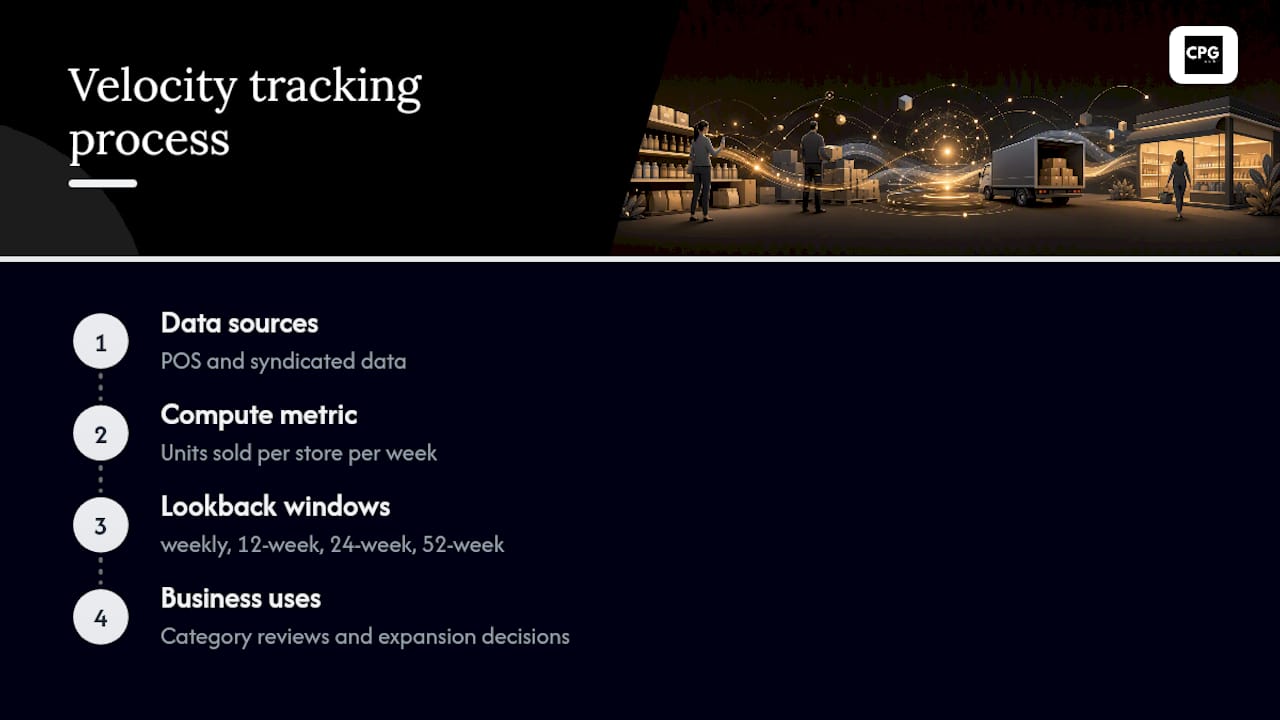
Velocity tracking is the ongoing measurement of that sales rate across weekly, 12-week, 24-week, and 52-week windows, using POS or syndicated data to inform category reviews and expansion decisions.
What Does Velocity Mean for Sales Performance?

High velocity means a product moves quickly relative to its category, which justifies its shelf space; low velocity signals risk of reduced facings or delisting, regardless of overall revenue.
How Do You Track Sales Velocity?
Pull POS or syndicated scan data first, calculate units per store per week over a consistent lookback window, and validate against sellable velocity to rule out stockout distortion. Tools like the Cpgagent platform can automate that tracking alongside shelf-level monitoring.
Why Do Buyers Trust Velocity Over Shipment Data?
Shipments show what left your warehouse; velocity shows what customers actually bought, which is why buyers weight it far more heavily in category reviews and reset decisions.