

SKU rationalization is the disciplined process of scoring every item in your portfolio against sales, margin, and cost-to-serve data, then trimming or reinvesting based on what the numbers actually show. Done right, SKU rationalization can improve gross margin, free working capital tied in slow-moving inventory, and simplify downstream operations from forecasting to warehouse slotting. Done incorrectly, it may eliminate SKUs valued by customers.
Start this week, not next quarter:
- Pick one category with high SKU count and flat or declining margin.
- Export 12 months of sales, cost, and distribution data for every SKU in it.
- Run a basic 80/20 filter to see how much of your revenue comes from the bottom half of your list.
Programs that follow a structured process report net revenue gains of 1 to 4 percentage points and margin improvements of 3 to 6 percentage points. A well-run pilot on a single category typically surfaces its first actionable list within two to three weeks.
TL;DR:
- Focusing on one high-SKU, margin-sensitive category for initial pilots can yield 1 to 4 percentage point revenue gains and 3 to 6 point margin improvements.
- Combining 80/20 filtering, ABC/XYZ segmentation, and activity-based costing ensures accurate scoring by highlighting true profitability and demand variability.
- Running pilot projects on 10 to 15% of flagged SKUs for six to eight weeks allows validation of impact and minimizes major revenue risks.
- Continuous governance, including stage-gate rules for new launches, prevents portfolio re-proliferation and maintains margin improvements over time.
- Using platform tools like Cpgagent accelerates data collection, scoring, and scenario modeling, reducing project timelines from weeks to days.
Table of Contents
- Why SKU Rationalization Matters for Margin and Operations
- When Should You Run a SKU Rationalization Project?
- What Data and Metrics Do You Need to Score SKUs?
- Which Frameworks Actually Work for Scoring SKUs?
- How Do You Implement a SKU Rationalization Pilot?
- Who Should Own SKU Rationalization Decisions?
- What Mistakes Sink Most Rationalization Projects?
- Which Tools Actually Support This Work?
- Strategic Capability or One-Time Cleanup?
- Speed Up Your Rationalization Program With Cpgagent
- Key Takeaways
- Sources
- FAQ
Why SKU Rationalization Matters for Margin and Operations
A bloated assortment doesn't just sit quietly on the shelf. It taxes forecasting accuracy, ties up cash in inventory that turns twice a year instead of eight times, and forces your supply chain to run more changeovers, more short production runs, and more expedited freight than it should. The same Tellius analysis found firms that rationalize well see asset-productivity gains of 10 to 25%, on top of the margin and revenue lifts already mentioned.
The operational payoff is easy to underestimate. Fewer SKUs means fewer changeovers on the line, simpler slotting in the warehouse, and replenishment cycles that don't require constant expediting. Forecast accuracy improves almost automatically once you strip out the long tail of erratic, low-volume items that were dragging down your statistical models.
Retail and CPG researchers at Circana frame this as a growth question, not just a cost question: does each SKU still contribute to growth, serve a shopper need no other item fills, and run efficiently? A single SKU can fail all three tests and still be the one nobody wants to touch because it was the brand's original hero product.
Watch for these signals that a category is ripe for review:
- Gross margin has compressed over the last two to three quarters despite stable or rising volume.
- Days sales inventory (DSI) is trending up on more than 20% of SKUs in the category.
- Trade promotion spend on bottom-quartile items isn't moving the needle on velocity.
When Should You Run a SKU Rationalization Project?
Certain events should trigger a review immediately rather than waiting for the annual planning cycle. Margin compression across a category, a sudden spike in SKU count after a launch wave, trade promotion spend that stopped generating incremental lift, a major retailer delisting announcement, or a merger that duplicates half your portfolio all warrant an unscheduled look.
Outside of those triggers, most CPG teams run a full rationalization annually, timed to align with retail planogram resets, and supplement it with rolling monthly monitoring of velocity and margin outliers. The annual pass catches structural issues; the rolling review catches a SKU going bad before it drags down the whole category review.
When you're picking which category to tackle first, weight three factors: SKU count relative to category revenue, complexity (number of package formats, flavors, or channel-specific variants), and strategic risk (how exposed the category is to a single retailer or private label competition). Categories that score high on all three are your best pilot candidates, because the upside is largest and the political resistance is usually lowest.
What Data and Metrics Do You Need to Score SKUs?
Objective scoring depends on having the same fields for every SKU, not a patchwork where some items have full cost data and others only have sales history. Skipping this step is the single most common reason rationalization projects get overturned in the executive review meeting.
At minimum, gather: SKU identifier, category, channel, unit sales, net price, cost of goods sold (COGS), trade and promotional spend, distribution points (ACV), return rate, supplier lead time, minimum order quantity or lot size, and warehousing/storage cost per unit.
From that dataset, four metrics do most of the analytical work:
| Metric | What it tells you |
|---|---|
| Sales velocity | Units sold per store per week; flags fading demand early |
| GMROI | Gross margin return on inventory investment; ties margin to capital tied up |
| Days of supply (DOS) | How long current inventory lasts at current sell-through |
| Contribution margin | Revenue minus true variable cost, including trade spend and returns |
Pro Tip: Use a minimum 12-month lookback so you capture a full seasonal cycle, and exclude SKUs launched in the last two quarters from your elimination list entirely. New items need a full season to prove themselves before the data can fairly judge them.
A few practical notes on the dataset itself:
- Returns and shrink data are often missing from a first pull. Chase them down. They change the ranking more than people expect.
- Lot size and lead time matter because a SKU can look profitable on paper and still be a cash drag if the supplier's minimum order ties up six months of inventory.
- Build the dataset once, in one shared file or a tool built for this, so finance, supply chain, and sales are arguing from the same numbers instead of three different spreadsheets.
Which Frameworks Actually Work for Scoring SKUs?
No single framework catches everything, but three combine well and give you a defensible, ranked action list.
- 80/20 (Pareto) filtering. Rank SKUs by revenue or contribution margin and check what share of total value comes from the top 20%. In most CPG categories, the bottom 20 to 30% of SKUs by revenue contribute in the low single digits of total category profit. This is your first, coarse filter, not your final answer.
- ABC/XYZ segmentation. ABC ranks SKUs by value (A being high-value), while XYZ ranks them by demand variability (X being stable, Z being erratic). Cross them and you get nine buckets. An AZ SKU (high value, erratic demand) needs a different fix than a CZ SKU (low value, erratic demand): the first might need better forecasting support, the second is a delist candidate.
- Contribution-margin and activity-based costing. This is where most naive rationalization projects fail. Gross margin alone hides the true cost of a SKU that requires a dedicated production changeover, extra warehouse slots, or a rush freight lane every time it's ordered. Activity-based costing allocates those real costs back to the SKU that causes them.
Here's a worked example. Gross margin alone flags it for elimination. But activity-based costing reveals it only requires one changeover per quarter, shares packaging with your hero SKU, and sits in the "high value, stable demand" (AX) bucket. That SKU moves from "eliminate" to "keep, reprice."
Build a simple decision matrix crossing contribution margin (rows) against strategic fit or distinct shopper need (columns). SKUs in the bottom left (low margin, no distinct need) are your clearest eliminations. Everything else needs a human decision, not just a formula.
How Do You Implement a SKU Rationalization Pilot?
Run this as a structured pilot, not a one-time cleanup. Shopify's implementation guide frames it as an ongoing audit cycle rather than a single event, and that framing matters for how you scope the first pass.
- Scope the category. Pick the pilot category from your priority triggers, and set a hard boundary on which channels and regions it covers.
- Prepare the data. Pull the full dataset described above; fix gaps before scoring, not after.
- Score every SKU. Apply the 80/20 filter, then ABC/XYZ, then contribution margin. Produce a ranked list with a recommended action: keep, reprice, reformulate, or eliminate.
- Simulate the impact. Model what happens to category revenue and margin if you execute the recommended actions. Scenario modeling at this stage should account for cannibalization and substitution, since a customer who can't find their eliminated SKU often just buys a competitor's, not your other item.
- Pilot on a subset. Execute the plan on 10 to 15% of the flagged SKUs first, in a limited set of stores or accounts, for six to eight weeks.
- Phase out safely. Coordinate with suppliers on remaining purchase orders, run clearance promotions where needed, and confirm barcode and identifier records are updated so discontinued items don't linger in ordering systems.
- Monitor and scale. Track substitution rates and margin against your pilot targets for at least one full sell-through cycle before rolling the framework out to the next category.
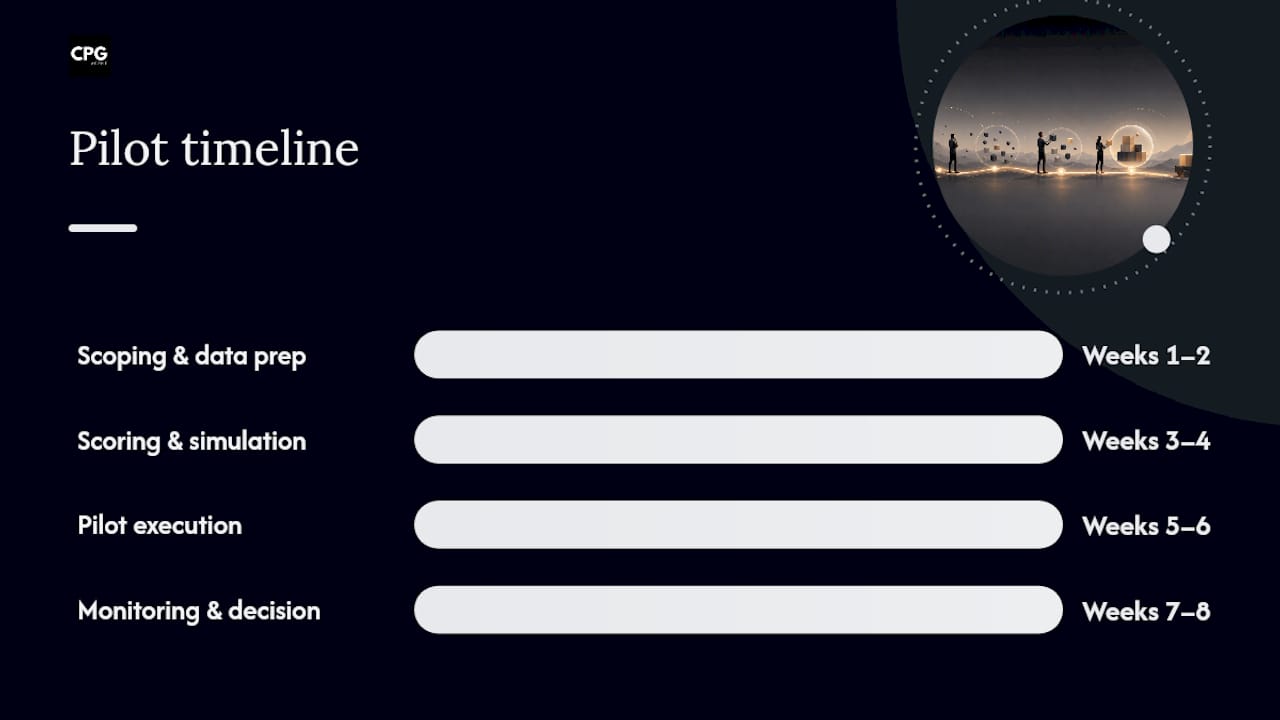
A sample eight-week timeline: weeks 1 to 2 are scoping and data prep (owned by the category lead and analytics team); weeks 3 to 4 are scoring and simulation (analytics plus finance); weeks 5 to 6 are pilot execution (supply chain and sales); weeks 7 to 8 are monitoring and the go/no-go decision on scaling. Set guardrails up front: if category revenue drops more than an agreed threshold during the pilot, pause and investigate before proceeding.
Use panel or loyalty data to measure incrementality during the pilot rather than assuming every lost unit sale is truly lost. Some of it shifts to a SKU you kept.
Who Should Own SKU Rationalization Decisions?
Rationalization fails more often from politics than from bad math. Assign clear ownership before scoring starts, not after someone's favorite SKU shows up on the elimination list.
- Category lead owns the final keep/eliminate recommendation and answers to the P&L.
- Supply chain owner validates lead times, minimum order quantities, and phase-out logistics.
- Finance approver signs off on the contribution-margin methodology and confirms savings estimates before they go to leadership.
- Sales or retail liaison flags accounts where a SKU drives shelf placement or a key relationship beyond its raw numbers.
Set a numeric escalation rule up front: any SKU scoring below your contribution-margin threshold but flagged by sales as strategically important goes to a joint category lead and finance review, not an automatic cut. Before finalizing any phase-out, confirm supplier contract terms, remaining inventory commitments, and packaging return obligations. An academic case study of a national restaurant chain found coordinated supplier collaboration produced $6.7 million in savings on a rationalization effort that a category team could not have delivered alone.
What Mistakes Sink Most Rationalization Projects?
The most common failure is scoring on gross margin alone. It hides true cost-to-serve, and it's how good SKUs end up on the chopping block while genuinely expensive ones survive. The fix is activity-based costing, applied consistently, even though it takes longer to set up.
The second failure is treating rationalization as a one-time event. Forrester's research on portfolio optimization makes the case, in a different domain, that continuous optimization delivers more durable value than a periodic purge, and the same logic holds for physical SKUs: without stage-gate discipline on new launches, the portfolio just re-bloats within 18 months.
Pro Tip: Build a stage-gate requirement into your new-product process: no SKU launches without a defined sunset review date already on the calendar. It's far easier to retire a SKU on schedule than to fight for its removal after it has a sales history and an internal champion.
AlixPartners' analysis of portfolio rationalization warns that haphazard pruning can cut revenue without actually reducing complexity, since the underlying causes of proliferation (unclear ownership, no stage-gate, promotion-driven variant creep) stay in place. Governance, not a single cleanup sprint, is what makes the gains stick.
Which Tools Actually Support This Work?
You need tooling across five categories: SKU-level analytics and BI for the core scoring, demand and incremental-volume modeling for simulation, activity-based costing tools for true cost-to-serve, continuous monitoring and alerting so you catch a SKU going bad before the next annual review, and retail panel integration to bring in POS and shopper data.
When evaluating any tool, check for data connectors into your ERP and point-of-sale systems, the ability to blend structured sales data with unstructured signals like review sentiment and social listening, built-in scenario modeling, and explainable recommendations your finance team can actually audit rather than a black-box score. Full-context analysis that mixes POS data with unstructured signals helps distinguish a fixable underperformer from a true delist candidate, which spreadsheet-only approaches routinely miss.
The right stack turns rationalization from an annual fire drill into ongoing portfolio health monitoring, which is where the sustained margin gains actually come from.
Strategic Capability or One-Time Cleanup?
Most companies treat SKU rationalization as a cleanup project you run when margins get bad enough to force the conversation. That's a mistake. Treated as a recurring capability, with stage-gates on new launches and rolling monitoring, it prevents the proliferation that caused the problem in the first place.
A tactical cleanup still has its place for a category in acute distress. However, the real return comes from building the governance once and letting it run. A reasonable first-year roadmap: pilot one category in quarter one, expand to your top three categories by quarter three, and have continuous monitoring live across the full portfolio by month twelve.
Speed Up Your Rationalization Program With Cpgagent
Cpgagent replaces months of spreadsheet wrangling with AI-assisted scoring, direct connectors to POS and panel data, and scenario modeling that shows the revenue and margin impact of a delist decision before you commit to it.
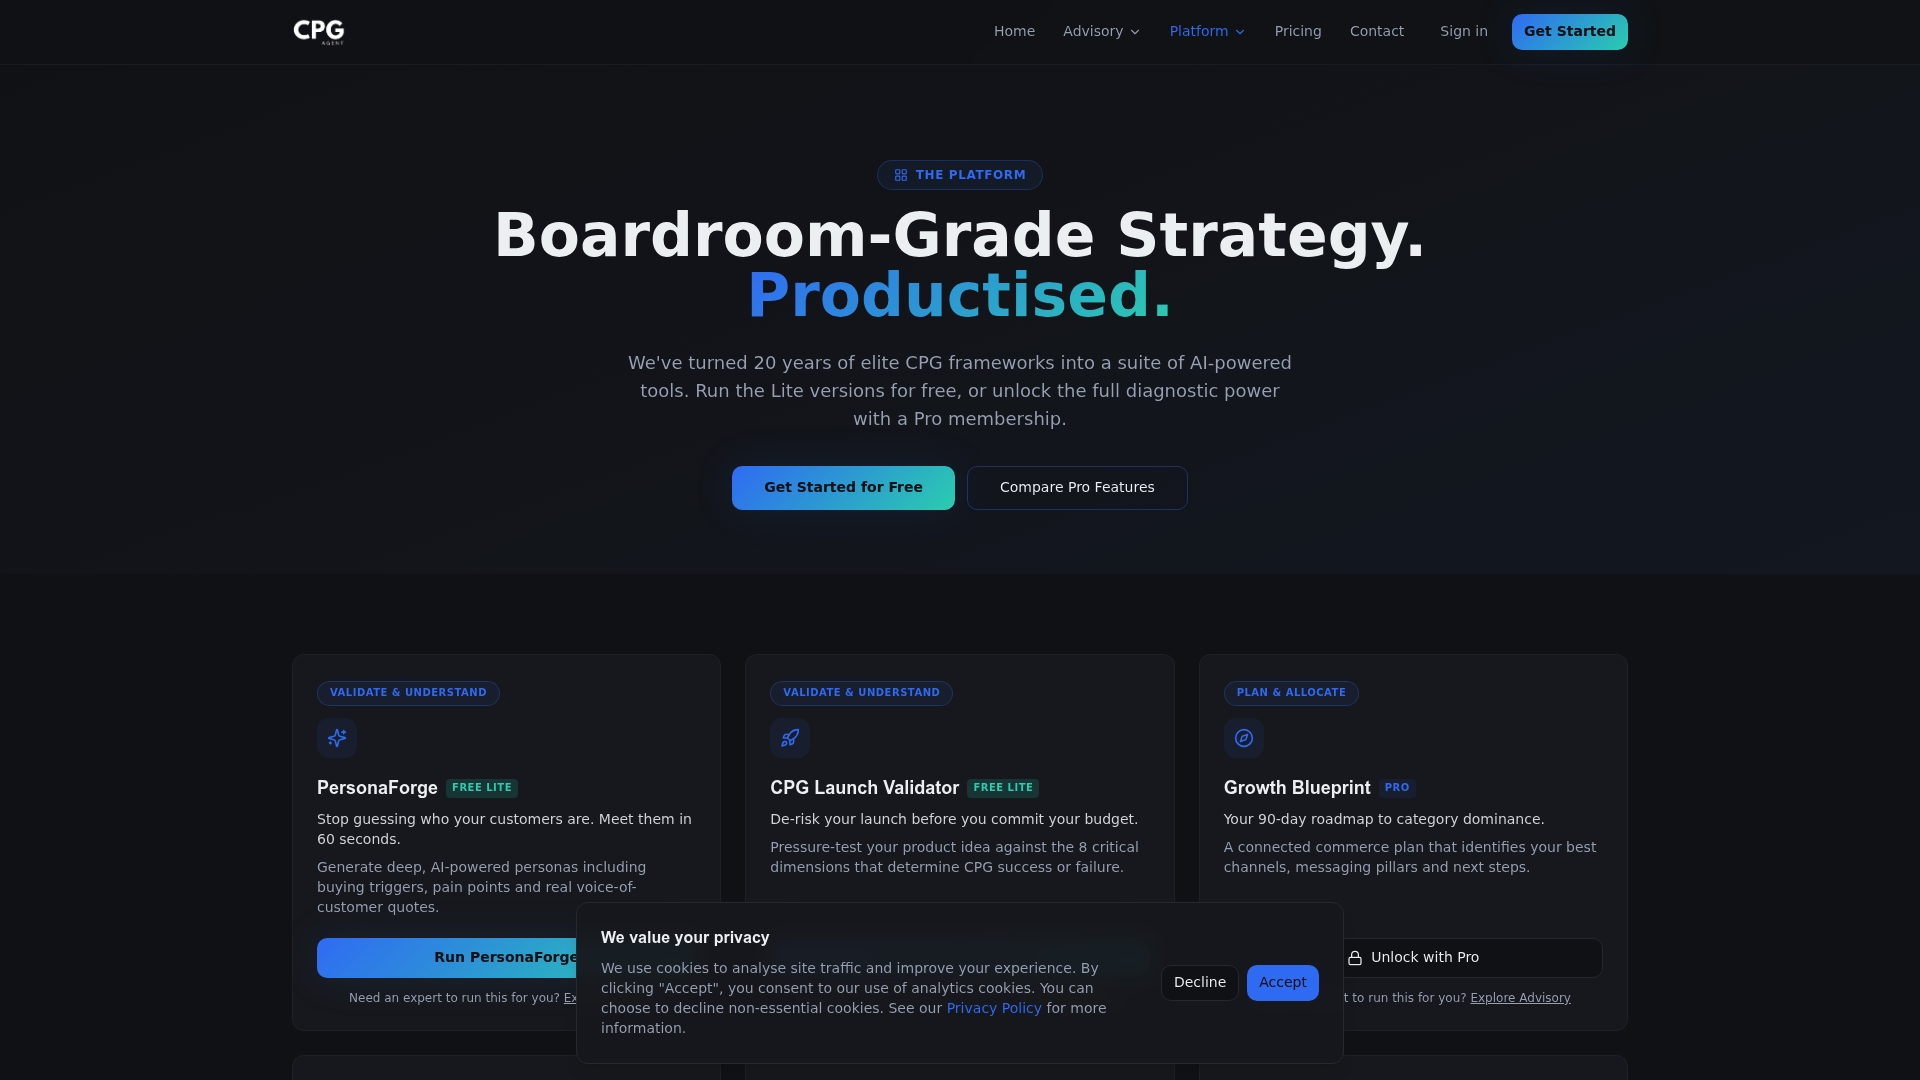
Instead of building a data pipeline from scratch or hiring a full analytics team, brands use the Cpgagent platform to run the scoring and simulation steps described above in days instead of weeks, with a fractional CMO or growth advisor available to sit in the governance conversations and defend the methodology to finance. Clients running structured portfolio work through the platform typically shorten their pilot timeline and get to a defensible, ranked SKU list faster than a manual process allows. If you're planning a category pilot this quarter, start by requesting a walkthrough of the platform's scoring tools and see how your own dataset scores against the frameworks above.
Key Takeaways
SKU rationalization raises margin and frees working capital only when scoring combines contribution margin, true cost-to-serve, and continuous governance rather than gross margin alone.
| Point | Details |
|---|---|
| Start with one category | Pick a high-SKU-count, margin-compressed category for your first pilot rather than the whole portfolio. |
| Score beyond gross margin | Combine 80/20 filtering, ABC/XYZ segmentation, and activity-based costing to avoid cutting hidden winners. |
| Pilot before you cut | Test recommended actions on 10 to 15% of flagged SKUs for six to eight weeks before full rollout. |
| Make it continuous | Pair the initial cleanup with stage-gate rules on new launches so the portfolio doesn't re-bloat. |
| Use the right platform | Cpgagent's platform connects POS and panel data to scenario modeling to speed up scoring and pilot design. |
Sources
- What Is SKU Rationalization? Benefits and Implementation (Shopify)
- SKU Rationalization for Growing Brands: Protecting Margins Without Compromising Growth
- Turn application portfolio rationalization into a continuous optimization capability (Forrester)
- Stock keeping unit rationalization: a cross-functional, cross-firm perspective (Emerald)
FAQ
What Is the 80/20 Rule for SKU Rationalization?
The 80/20 rule (Pareto principle) means roughly 80% of category revenue or profit typically comes from about 20% of SKUs. It's used as a first filtering pass, not a final decision, since some low-revenue SKUs still serve a strategic or distinct shopper need.
What Does It Mean to Rationalize a SKU?
Rationalizing a SKU means scoring it against sales velocity, contribution margin, and true cost-to-serve, then deciding to keep, reprice, reformulate, or eliminate it based on that evidence rather than gut feel or trailing sales alone.
What Does SKU Mean?
SKU stands for stock keeping unit, a unique code assigned to a specific product variant, including its size, flavor, or packaging, so it can be tracked individually through inventory and sales systems.
How Do You Perform SKU Analysis?
Gather 12 months of sales, cost, and distribution data per SKU, calculate velocity, GMROI, days of supply, and contribution margin, then rank items using an 80/20 filter combined with ABC/XYZ segmentation to produce a scored action list. A platform like Cpgagent can automate much of this scoring against your existing POS and panel data.
How Often Should You Run SKU Rationalization?
Most CPG teams run a full rationalization annually, aligned with retail planogram resets, and supplement it with rolling monthly monitoring so a struggling SKU gets flagged before the next full review.