

Incremental distribution gains are the net increase in sell-through or velocity a product generates above its established baseline once distribution expands, whether through new doors, better shelf placement, or improved online availability. For CPG teams, this number is the difference between a listing win that actually pays back and one that just adds inventory risk. Measurement providers like CPG Agent treat it as the connective metric between distribution strategy and trade spend return.
- Baseline volume: what you'd sell without the change
- Incremental volume: the lift attributable to the new distribution
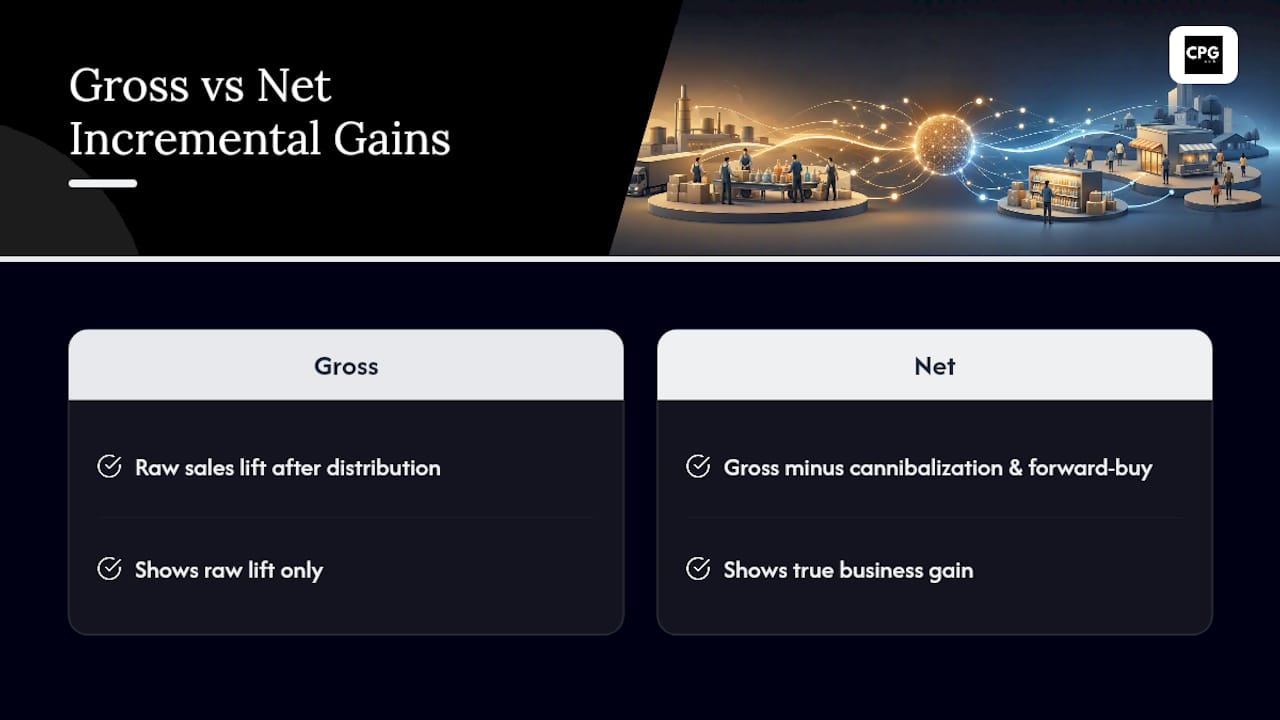
- Net incremental: gross lift minus cannibalization and forward-buy
A brand that adds new doors but sees flat velocity per door hasn't generated real incremental gains. It has just spread the same demand thinner, a distinction that becomes obvious once you decompose sales volume into baseline plus incremental volume.
Key Takeaways
Incremental distribution gains only count once you've netted out cannibalization and forward-buy from the gross lift, and velocity per door should gate every expansion decision.
| Point | Details |
|---|---|
| Define the metric precisely | Incremental distribution gain is net lift above baseline, not raw door count or gross sell-in. |
| Net out the noise | Subtract cannibalization and forward-buy from gross incremental to get the true business impact. |
| Choose the right data source | Cross-check shipment data against POS scans since sell-in alone overstates real demand. |
| Test before scaling | Use matched-store or geo-experiments with a 12-week window to confirm lift is real. |
| Measure with a built platform | Cpgagent's velocity-per-door dashboards and trade ROI tools help teams catch stalling doors early. |
Table of Contents
- What Counts as Incremental Distribution Gains?
- How Do You Measure Incremental Distribution Gains?
- How Do You Calculate an Incremental Distribution Gain?
- What Tactics Actually Drive Distribution Gains?
- How Do You Test and Prove True Incremental Lift?
- What Red Flags Signal a Bad Distribution Read?
- How Does CPG Agent Support Distribution Measurement?
- Try the Platform Built for Distribution Measurement
- Sources
- FAQ
What Counts as Incremental Distribution Gains?
The term covers a specific slice of CPG performance measurement, and it's worth being precise about what falls inside versus outside the boundary.
Distribution itself gets measured through numeric distribution (raw door count), ACV or %ACV (all-commodity volume, meaning what share of retail dollars in the category flow through stores that carry your product), and weighted distribution (which weights doors by their sales importance). Baseline sales are what you'd expect without any change in distribution, promotion, or seasonality. Gross incremental is the raw lift after a distribution change; net incremental subtracts cannibalization (existing buyers just switching channels) and forward-buy (retailers stocking up early, borrowing from future periods).
Typical causes of incremental distribution gains include:
- New retailer listings or expanded SKU authorization
- In-store features, secondary displays, or endcap placement
- Direct store delivery (DSD) activation in independent or convenience channels
- eCommerce product detail page (PDP) improvements that lift online conversion and "buy again" rates
Panel data providers narrow the definition further. Nielsen and IRI typically count only shelf price cuts, secondary displays, and feature ads as incremental, which means other manufacturer activity gets folded into base volume. That's a critical nuance: a panel-reported "incremental volume" figure isn't the same thing as your total distribution-driven lift.
How Do You Measure Incremental Distribution Gains?
Six metrics do most of the work. Numeric distribution counts doors carrying the product. ACV/%ACV weights that by retail dollar relevance. Weighted distribution folds in store-level sales importance. Velocity per door tracks units sold per store per week, arguably the single most diagnostic number in this list. Promoted share shows what portion of volume moved on deal. Incremental units and percent lift tie the whole picture back to a dollar and percentage outcome.
Data sources come with real tradeoffs:
- Shipments/ship-in data shows what left the warehouse, fast but prone to overstating true demand
- POS/scan data shows what actually sold at register, the closest thing to ground truth
- Retailer portal data (Walmart Retail Link, Kroger 84.51°, etc.) gives item-level detail but varies by retailer format
- Panel data (Nielsen, IRI, SPINS) offers category benchmarking but lags real time and uses that narrower incremental definition
Baseline selection matters more than most teams assume. A four to eight week pre-period, adjusted for seasonality, is a common starting point, though holiday-heavy categories need a full prior-year comparison to avoid mistaking a seasonal bump for a distribution win. Get the baseline wrong and every lift calculation downstream gets distorted, sometimes by a wide margin, because incremental sales are simply total sales minus baseline.
How Do You Calculate an Incremental Distribution Gain?
Here's a worked example using round numbers so the math stays transparent.
- Establish baseline velocity. Say a snack brand sells 12 units per door per week across 500 existing doors before a new listing program.
- Measure post-listing velocity. After adding 150 doors and securing an endcap display in 100 of the original stores, velocity rises to 15 units per door per week across the full 650-door base.
- Compute gross incremental units. New weekly volume: 650 × 15 = 9,750 units. Old baseline projected across original doors: 500 × 12 = 6,000 units. Gross incremental lift: 3,750 units, representing a substantial gross gain.
- Adjust for cannibalization and forward-buy. If 400 of those units came from shoppers who previously bought the brand at a different retailer, and another 300 units reflect retailer forward-buy ahead of a promotion, net incremental drops to 3,050 units, representing a significant net gain.
- Convert to dollars and ROI. At an average unit price, the net incremental units translate to a meaningful increase in weekly incremental revenue, the figure you'd actually compare against the trade spend that funded the listing program.
That gap between 62.5% gross and 51% net is exactly why gross incremental estimates routinely overstate the real business gain unless someone nets out the noise.
What Tactics Actually Drive Distribution Gains?
Not every tactic deserves equal priority, and the right one depends on where the brand sits in its lifecycle.
- Supply reliability and depth comes first almost every time. Retailers cut low-fill-rate items before they cut low performers, so nothing else on this list matters if the product isn't consistently in stock.
- Targeted retailer listing programs work best for brands entering a new region or channel, focusing effort on retailers where the category is already growing.
- Feature, display, and secondary placement deliver fast, visible lift, useful for proving velocity before asking a buyer for permanent shelf expansion.
- Priced promotions tied to distribution can accelerate trial in new doors, though they're a short-term lever, not a durable one.
- DSD or distributor activation helps in convenience and independent channels where route-level relationships drive shelf presence more than headquarters negotiations do.
- eCommerce PDP improvements and sponsored placements matter increasingly, since online availability now functions as its own distribution channel with its own baseline and lift math.
New-to-market launches lean on listing programs and trial-driving promotions. Brands deepening penetration in existing accounts lean on display and DSD. Recovering a lapsed door usually means fixing the supply issue that got it delisted in the first place, then re-earning shelf space with a fresh feature ad.
Pro Tip: Treat distribution as a hypothesis to test, not a metric to chase. A channel that meets the criteria for repeatable, defensible customer access will keep paying off long after the initial listing win.
How Do You Test and Prove True Incremental Lift?
A clean test separates what distribution actually caused from what would have happened anyway.
- Select control stores or markets. Match them to test stores on category size, demographic profile, and prior velocity trend, not just geography.
- Size the sample appropriately. Fewer than 20 to 30 stores per arm usually produces too much noise to trust the result, especially in categories with high week-to-week variance.
- Set the measurement window. Twelve weeks is a reasonable minimum for most CPG categories, long enough to see past initial novelty spikes but short enough to isolate the distribution effect from unrelated seasonal shifts.
- Run holdout validity checks. Confirm the control group didn't receive its own promotional support or distribution change during the test window, which would contaminate the comparison.
Geo-experiments (comparing matched DMAs or store clusters) tend to give cleaner reads than pure before/after comparisons, since they control for what would have happened anyway. Marketing mix modeling (MMM) can help attribute lift across multiple simultaneous drivers, but it carries real caveats: MMM struggles to isolate a single retailer program when national media, seasonality, and competitor activity move at the same time. When a promotion and a new listing launch together, attribution gets genuinely ambiguous, and no model fully resolves that without a proper control group.
Pro Tip: Budget at least one full quarter for a defensible test. Faster reads are tempting, but a six-week window rarely outlasts normal category noise.
What Red Flags Signal a Bad Distribution Read?
A few patterns should make any CPG team pause before celebrating a distribution win.
- Baseline instability: if the pre-period itself was unusually high or low, every lift calculation downstream is skewed. Fix: use a longer or year-over-year baseline window.
- Over-reliance on sell-in: shipment data looks great right up until a retailer's inventory correction wipes it out. Fix: always cross-check against POS scan data.
- Ignoring cannibalization and forward-buy: gross numbers flatter every program. Fix: net out both before reporting ROI.
- Velocity decline as doors expand: a sign the brand is spread too thin rather than genuinely growing.
- Data gaps between retailers: inconsistent POS reporting formats can make cross-retailer comparisons misleading. Fix: normalize to a common weekly unit basis before comparing.
When velocity per door falls below the category's minimum viable threshold for two consecutive measurement periods, that's usually the signal to pause expansion rather than push further.
How Does CPG Agent Support Distribution Measurement?
Running this math manually across dozens of retailers and SKUs is where most CPG teams lose the thread. The CPG Agent platform pulls in retailer scan data and panel feeds, then surfaces velocity-per-door dashboards so a stalling door shows up before it becomes a delisting.
- Automated ingestion of shipment, POS, and panel data into one measurement view
- Experiment templates for test-and-control distribution programs
- Trade ROI calculators that separate gross from net incremental impact
- Fractional CMO and growth advisory support for teams that want to run these tests without building an internal analytics function from scratch
Instead of a long agency discovery phase, the platform is built to get a measurement framework running fast, matching the pace at which retail decisions actually get made.
A Note on Prioritizing Profitable Distribution
Door count is a vanity metric until velocity per door proves it out. I'd rather see a brand hold at 500 doors with rising per-door velocity than chase 800 doors with flat sell-through. Run the net incremental math from the worked example above before celebrating any listing win.
Try the Platform Built for Distribution Measurement
Most brands find out a listing program failed only after the retailer pulls the plug, usually a quarter too late to fix it. Cpgagent gives CPG teams a faster read: velocity-per-door dashboards and trade ROI calculators that flag a stalling door while there's still time to act, instead of after a delisting notice arrives.

If you're planning a retailer expansion or trying to prove out a trade spend program, the Cpgagent platform connects your shipment, POS, and panel data into one velocity view, and the team also offers fractional CMO and growth advisory support for brands that want expert hands running the test design. Start by mapping your current door count and velocity baseline against the Cpgagent toolset to see where the next incremental gain is hiding.
Sources
- Baseline and Incremental Volume - Marketing Mix Modelling
- Spread Too Thin: Why Distribution Is a Hypothesis, Not a Growth Metric
- Distribution-First Playbook for Startups | Growth And Scaling | Bulletpitch
FAQ
What Is the Difference Between Gross and Net Incremental Distribution Gains?
Gross incremental is the raw sales lift after a distribution change, while net incremental subtracts cannibalization and forward-buy to show the true business gain.
How Long Should You Measure Before Trusting a Distribution Lift?
A 12-week measurement window is a reasonable minimum for most CPG categories, long enough to move past novelty spikes but short enough to isolate the distribution effect.
Why Do Nielsen and IRI Incremental Numbers Sometimes Look Off?
Panel providers typically count only shelf price cuts, secondary displays, and feature ads as incremental, so other manufacturer activity gets folded into base volume and can produce counterintuitive results.
Can Adding More Doors Actually Hurt Sales Performance?
Yes. Expanding distribution without sustaining velocity per door can spread demand too thin, a pattern that often precedes delistings and revenue corrections.

How Does Cpgagent Help Measure Incremental Distribution Gains?
Cpgagent's platform ingests shipment, POS, and panel data into velocity-per-door dashboards and trade ROI calculators, letting teams catch a stalling door before it turns into a delisting.