

If your number sits below that band, check two things before anything else: checkout completion rate and mobile page speed, because those two levers usually explain most of the gap between average and excellent.
TL;DR:
- Check your checkout completion rate and mobile page speed if your conversion rate falls below 2.5%, as these are common causes of gaps.
- Mobile conversion is typically 30% lower than desktop due to slower, less user-friendly mobile experiences, which can be improved with speed optimizations.
- Benchmark your metrics against similar traffic sources, as email and organic traffic usually convert higher than paid social, which is colder traffic.
- Prioritize fixing page load speed, checkout friction, and product page content before launching large redesigns to maximize revenue impact.
- Conduct structured CRO tests, focusing on high-traffic pages first, with a goal of shipping 12 to 20 winning experiments per year for sustainable growth.
Table of Contents
- Shopify Conversion Rate CPG Benchmarks: The Numbers That Matter
- How Should You Actually Calculate Your Conversion Rate?
- What CVR Should You Expect by CPG Category, Device, and Channel?
- The High-Impact CRO Checklist for Shopify CPG Stores
- How Do You Prioritize Tests Without Fooling Yourself?
- A 90-Day CRO Sprint for Shopify CPG Stores
- How CPG Agent Fits Into This Sprint
- What This Guide Gets Right That Most CRO Advice Misses
- Get a Managed CRO Sprint Instead of Building One From Scratch
- Sources
- FAQ
Shopify Conversion Rate CPG Benchmarks: The Numbers That Matter
Session-based conversion rate is the number most CPG teams quote, and it's also the number most often misread. Global ecommerce averages tend to land around 2% to 3% on a session basis, though the exact figure shifts depending on traffic mix, device split, and how a platform defines a "session" in the first place, according to Statista's shopper conversion data. CPG brands selling consumable, lower-consideration products (snacks, supplements, personal care) often sit at the higher end of that range because purchase decisions happen faster than they do for big-ticket categories.
Here's a snapshot of what "typical" and "top performer" actually look like across the metrics that matter most for a Shopify CPG store:
| Metric | Typical Range | Top 10-20% |
|---|---|---|
| Sitewide session CVR | 2%–3% | 4%+ |
| Checkout completion rate | 45%–65% | 65%+ |
| Mobile CVR | Lower than desktop, often by 30% relative | Near desktop parity |
| Desktop CVR | Higher baseline | Highest overall |
| Email traffic CVR | Well above sitewide average | 5%+ |
| Paid social CVR | Below sitewide average | 2%+ |
Checkout completion deserves its own callout because it's the single biggest leak point on most Shopify CPG stores. Once a shopper adds to cart, you'd expect most of them to finish, but that's rarely how it plays out. If your completion rate sits at the low end, the fix usually isn't a redesign. It's friction: an extra form field, a shipping cost that surprises people at the last step, or a payment method that isn't there when they need it.
Device split changes the picture further. Mobile traffic dominates for most Shopify CPG stores, often accounting for the majority of sessions, yet mobile conversion typically trails desktop by a wide margin, according to Statista's mobile traffic share data. That gap isn't really about intent. Mobile shoppers convert at lower rates mainly because mobile experiences are slower and clunkier than desktop ones, not because mobile shoppers are less serious buyers.
Traffic source matters just as much as device. A few patterns show up consistently across CPG stores:
- Email traffic converts well above sitewide averages because the audience already knows the brand.
- Direct traffic (typed URL, bookmarks) tends to convert strongly for the same reason.
- Paid search sits closer to the sitewide average, sometimes a bit above it depending on intent match.
- Paid social usually converts below average because it interrupts rather than responds to demand.
One caution before you start benchmarking against any of these numbers: major shopping events distort short windows badly. Prime Day and similar events pull forward demand and shift traffic quality, and one industry estimate pegged the event's lift to US online sales at $2 to $3 billion in a single stretch. If you're comparing your CVR to last month and last month included a major sale event, you're not comparing like to like.
How Should You Actually Calculate Your Conversion Rate?
There are three ways to define conversion rate, and mixing them up is the fastest way to make a bad decision look good.
Session-based conversion rate divides orders by sessions. This is the Shopify and Google Analytics 4 default, and it's what most benchmarks (including the ones above) are built on. It's useful because it's standardized, but it has a real limitation: one visitor browsing five times counts as five sessions, which can understate your rate if you have a lot of return visits before purchase.
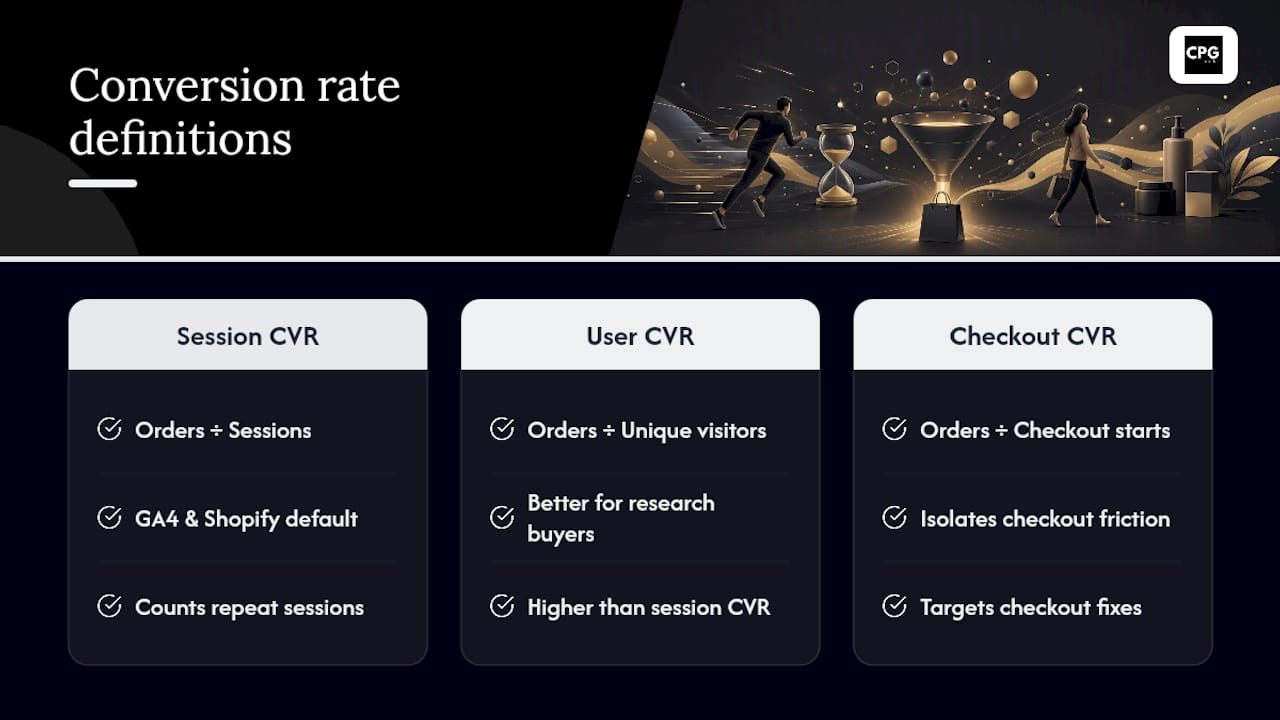
User-based conversion rate divides orders by unique visitors instead of sessions. It tends to run a bit higher than session-based CVR because it doesn't penalize repeat browsing. Few Shopify reports lead with this number, but it's worth tracking if your CPG products involve research before purchase, like supplements or specialty foods.
Checkout-based conversion rate measures completed orders against checkout starts rather than sessions. This is the number that isolates checkout friction specifically, separate from whatever happened upstream on the product page.
For reporting that actually drives decisions, split every one of these by device and by traffic source before you draw conclusions. A blended sitewide number hides more than it reveals. And pair conversion rate with revenue per visitor (RPV) every time you report it. CVR alone can rise while revenue falls, which happens more often than most teams expect.
What CVR Should You Expect by CPG Category, Device, and Channel?
Not every CPG subcategory converts the same way, and treating a supplement brand's benchmark as the standard for a beverage brand will lead you to the wrong conclusions.
| CPG Subcategory | Typical Behavior Pattern |
|---|---|
| Food & beverage | Fast decisions, frequent repeat purchase, often higher session CVR |
| Beauty & personal care | More research before purchase, benefits from video and reviews |
| Supplements & wellness | Longer consideration for new customers, subscription models raise lifetime CVR |
| Household goods | Price-sensitive, bundle and multi-pack offers move CVR meaningfully |
Food and beverage brands generally see the fastest path from landing to purchase because the products are familiar, low-risk, and often habitual. Beauty and personal care brands face more resistance, since shoppers want to see the product in use before committing, which is where product page content earns its keep. Supplements and wellness brands often struggle more with first-time conversion because the category carries more skepticism, but subscription and reorder models push effective lifetime conversion well above the first-purchase number. Household goods brands live and die on price perception, so bundle framing and multi-pack thresholds do more work here than almost anywhere else.
Mobile versus desktop follows the same broad pattern across categories, but the gap tends to be worse for CPG specifically because grocery-adjacent and personal-care browsing happens heavily on phones, often while shoppers are doing something else at the same time. That's a device experience shopping for attention, not a device with room for a slow page.
Traffic source reshapes expectations further. A CPG brand running mostly paid social should not benchmark against a brand whose traffic comes primarily from email and organic search. Paid social traffic is colder, browsing-stage traffic. Comparing its conversion rate directly to an email-fed store's rate will make a healthy paid social program look broken when it isn't.
The High-Impact CRO Checklist for Shopify CPG Stores
Some fixes move the needle immediately. Others matter but take longer to show up in the numbers. Here's the order that tends to deliver the most revenue for the least effort, based on repeated patterns across CPG stores.
-
Fix page speed first. Compress images, remove apps you aren't using, and audit your theme for bloat. Every second of load delay has been linked to a measurable drop in conversion, with some D2C analyses citing losses around 7% per second of delay. This is the highest-leverage, lowest-cost fix on the list.
-
Rebuild product page hero content. Lead with the benefit, not the ingredient list. Shoppers decide in seconds whether to keep reading.
-
Simplify variant selection. If a shopper has to guess which size or flavor fits their needs, they'll often abandon rather than ask.
-
Add shoppable video where it earns its place. Video on product pages can lift add-to-cart rates and reduce returns, but only when it loads fast and doesn't compete with page speed. Treat it as a lever to test, not a default to add everywhere.
-
Turn on guest checkout. Forcing account creation before purchase is still one of the most common unnecessary friction points on Shopify CPG stores.
-
Move to one-page checkout with express payment options. Apple Pay, Google Pay, and Shop Pay reduce the number of fields a shopper has to fill manually, which matters most on mobile.
-
Show full costs earlier. Shipping surprises at the final step are one of the most reliable causes of cart abandonment across every CPG subcategory.
-
Place trust signals near the buy button, not just in the footer. Reviews, guarantee badges, and shipping timelines convert better next to the add-to-cart button than buried lower on the page.
-
Reframe pricing around bundles and thresholds. Free-shipping thresholds and multi-packs move average order value and conversion together, especially for household and food categories.
Pro Tip: Run your page speed audit on a mid-range Android phone, not your own iPhone on office wifi. That's closer to what a real chunk of your mobile traffic is actually dealing with.
How Do You Prioritize Tests Without Fooling Yourself?
Not every test is worth running, and not every "win" is actually a win. Before you launch anything, calculate your minimum detectable effect (MDE): the smallest lift your current traffic volume can reliably detect. Low-traffic product pages often can't detect anything smaller than a 10% to 15% lift within a reasonable testing window, so testing a button color change there is close to a waste of time. Save small tweaks for high-traffic pages and save low-traffic pages for bigger, bolder changes.
The guardrail that matters more than CVR itself is revenue per visitor. A test can lift conversion rate while quietly dragging down average order value, often because a discount-forward variant pulls in more low-intent buyers. Pixeltree's Shopify CRO playbook recommends treating RPV as the primary decision metric precisely because CVR-only wins can hide that trade-off.
What a disciplined testing program actually looks like: operators running structured CRO programs report shipping roughly 12 to 20 winning tests per year out of 40 to 60 tests run, with individual winners often lifting the tested surface by 4% to 12%, per Pixeltree's operator data. That's a win rate closer to one in three, not one in one. Expect losers. Plan for them.
A few habits keep the whole process honest:
- Run tests for full weekly cycles to avoid day-of-week skew, never just a few days.
- Don't stack multiple tests on the same page in the same window; you can't tell which change moved the number.
- Log every completed test, win or loss, so you don't retest the same idea eighteen months later.
- Weight decisions by RPV and completion rate together, not CVR in isolation.
Peer-reviewed behavioral research backs the broader pattern here: UX and page-experience interventions show up repeatedly as reliable levers in controlled studies, which is part of why speed and friction fixes outperform cosmetic changes so consistently.
A 90-Day CRO Sprint for Shopify CPG Stores
You don't need a year-long roadmap to see movement. You need the first 30 days spent on fixes that show results fast, and the next 60 spent building on what worked.
- Days 1-10: Audit and verify tracking. Confirm GA4 and Shopify analytics agree on session counts, checkout starts, and completed orders. Broken tracking makes every later decision worse.
- Days 11-20: Fix checkout friction. Turn on guest checkout, add express payment options, and surface shipping costs before the final step. These changes tend to show impact within one to two weeks of traffic.
- Days 21-30: Fix your top-performing product pages first. Rewrite hero copy, simplify variant selection, and compress images on your five highest-traffic SKUs. Don't touch your whole catalog yet.
- Days 31-45: Launch landing page experiments matched to traffic source. A paid social landing page should read differently than an email landing page; test that distinction directly.
- Days 46-60: Roll out express checkout and speed fixes storewide. By now you've validated what works on your top pages; extend it everywhere.
- Days 61-75: Scale winning variants and retire losers. Apply confirmed winners across your full catalog, not just the test group.
- Days 76-90: Start retention and repurchase experiments. Subscription prompts, post-purchase upsells, and reorder reminders extend conversion value past the first sale.
Expect checkout fixes to show measurable movement within two to three weeks. Product page and speed fixes usually take four to six weeks to show a stable signal, because you need enough sessions to trust the number. Anything faster than that is probably noise, not a win.
How CPG Agent Fits Into This Sprint
Running this sprint manually across analytics, product pages, checkout, and testing cadence takes real bandwidth, which is exactly the gap Cpgagent is built to close for CPG teams. Tools like PersonaForge help teams sharpen product page messaging around what actual buyers respond to, rather than guessing at benefit copy. Launch Validator gives teams a way to pressure-test positioning before sinking budget into a redesign that might not move CVR at all.
For teams that want more than software, fractional CMO and growth advisory services can map directly onto the 90-day sprint. That includes prioritizing which SKUs get PDP attention first, setting realistic MDE targets before testing, and reviewing RPV trends so a "win" doesn't quietly erode margin. Brands that want a managed version of this roadmap rather than a DIY one can review available toolsets on platforms like the Cpgagent platform page.
What This Guide Gets Right That Most CRO Advice Misses
Most conversion advice treats every ecommerce store the same, and that's where it falls apart for CPG brands specifically. A supplement brand fighting first-purchase skepticism has a different problem than a snack brand competing on impulse buys, yet both get handed the same generic "add urgency banners" playbook.
The overrated fix, in my view, is wholesale redesigns. Teams love a redesign because it feels like progress, but the data keeps pointing at boring, specific friction: a shipping surprise at checkout, a slow mobile image, a variant selector nobody can parse. Fix those first. A full redesign without fixing checkout friction is like repainting a car with a flat tire.
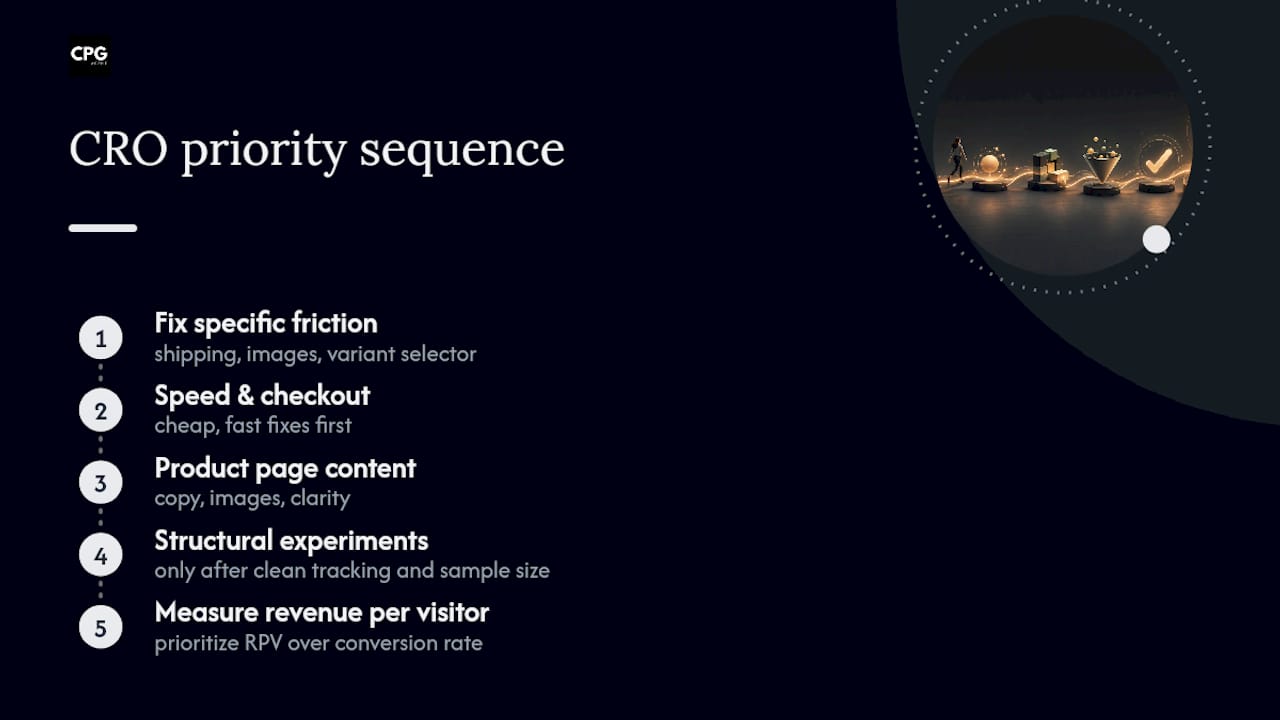
What the research actually supports is a strict order of operations: speed and checkout first, because they're cheap and fast to fix, then product page content, then bigger structural experiments once you've got clean tracking and a real sample size. Skipping straight to "big swing" tests before fixing the basics is why so many CRO programs report a lot of activity and very little revenue movement.
Prioritize revenue per visitor over raw conversion rate from day one. It will save you from celebrating a win that's actually a margin problem in disguise.
— Matthew
Get a Managed CRO Sprint Instead of Building One From Scratch
This platform offers an alternative to hiring a full agency team for CPG conversion optimization by providing AI-driven tools built specifically for CPG product pages and growth experiments, plus fractional marketing leadership, without the retainer size a traditional agency requires.
If you've read this far, you already know the sprint works. The question is whether you have the internal bandwidth to run analytics audits, checkout fixes, PDP rewrites, and structured testing all at once over 90 days. This platform gives CPG and FMCG marketing teams tools like product messaging and launch validation, alongside fractional CMO support for teams that want senior strategy without a full-time hire. It is built for brands at any stage, from startups validating a first product to established brands modernizing an aging Shopify storefront. Check out the platform to see which tools map to your next sprint, or start with a conversation about fractional advisory if you'd rather hand off the roadmap entirely.
Sources
The benchmark figures throughout this guide draw on Statista's global shopper conversion data, Statista's mobile traffic share reporting, and Pixeltree's Shopify CRO playbook. For page speed and video-on-PDP specifics, The D2C Pulse's CRO guide is worth a full read. If you want to go deeper on channel-specific benchmarks, Cpgagent's guide to performance marketing channels for FMCG brands is a useful next stop.
- Online shopper conversion rate worldwide | Statista
- The Shopify CRO Playbook for D2C Brands (2026 Edition) | Pixeltree
- Conversion Rate Optimization for D2C Websites | The D2C Pulse
FAQ
What should my Shopify conversion rate be?
Where you land depends heavily on traffic source and device mix, so compare against stores with a similar channel blend.
Is 2.5% a good conversion rate?
Yes, 2.5% sits comfortably within the typical range for Shopify CPG stores and is close to the global ecommerce average. It's a solid baseline, but checking your checkout completion rate and mobile speed can often push it higher.
Is 12% conversion rate on a website good?
It's worth verifying how that number was calculated, since checkout-based or user-based rates run higher than session-based ones by definition.
Is Shopify still worth it in 2026?
Shopify remains a strong platform for CPG brands because of its checkout flexibility, app ecosystem, and native support for express payments and one-page checkout. The platform itself rarely limits conversion rate; friction in checkout flow, product page content, and page speed does far more damage than the platform choice.
How often should I run CRO tests on a Shopify CPG store?
Structured programs typically run 40 to 60 tests a year and ship 12 to 20 winners, running each test for full weekly cycles to avoid day-of-week distortion. Lower-traffic stores should run fewer, bigger tests rather than many small ones that can't reach statistical detection.